Daily Forex market analysis - graphical, wave and technical analysis online
Daily Forex* Trade News, Forex market analysis and Economic News online. In this section you will find a fundamental and technical analysis of the Forex market for trading online and Economic News.
Follow the publications of our experts, and you will be able to objectively assess the situation not only on the international currency market Forex, but on all other world trading platforms. With the help of professional analysis of the foreign exchange market, you can invest your money.
Forex Analytics and Daily FX & Economic News • 10 February 2026

Our daily Forex news of the Currency Market is written by industry veterans with years in trading on market Forex. Read the daily analytics, forecasts, technical and fundamental analysis from experts of the Currency, Cryptocurrency and CFD Market online.
EUR/USD Analysis on January 13, 2026
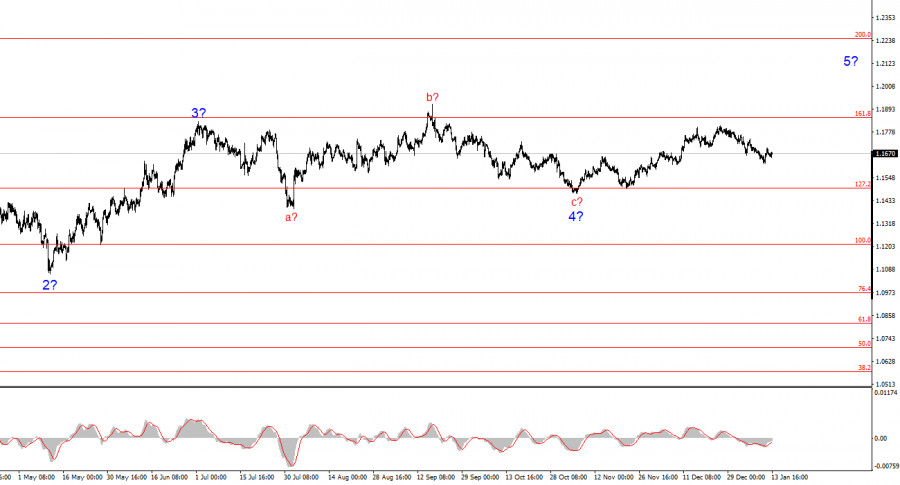
.The 4-hour chart wave count for EUR/USD has a clear, albeit complex, structure over the past few months (see lower chart). There is no indication that the upward segment of the trend, which began in January last year, has been canceled. However, the wave structure from July 1, 2025, onward has become extended. In my view, the pair has completed the formation of corrective wave 4, which has an unconventional internal structure. Within this wave, we observed exclusively corrective structures, leaving no doubt about its corrective nature.
I believe the upward trend segment is not yet complete, and its targets extend as far as the 25th level. In the coming weeks, we can expect the continued development of the upward wave set, which may eventually form a five-wave structure. However, there is no certainty that an impulsive segment of the trend is currently forming, so the entire upward wave set could complete in just three waves. In that case, a new downward segment—also corrective—may already be beginning.
The EUR/USD rate remained almost unchanged on Tuesday. I often note that prices can move significantly before the end of the day, as the US sessions are typically more active than the European and Asian sessions. Therefore, we could have expected price changes on Tuesday—if not for one "but": the market has been extremely passive in recent months, and even major events and reports now result in minimal price movements on the charts.
This week alone, at least two events would have normally triggered market turmoil. It is not every day that the US president (or his administration) files a criminal case against the Fed chair. It is not every day that inflation reports—crucial for the monetary policy of the embattled FOMC—are released. Yet, market movements have been comparable to a minor Polish consumer sentiment release on Monday or a Fed employee caught stealing on Tuesday. While EUR/USD is not completely static—the 4-hour chart shows movement—the price continues to form alternating corrective structures. Each of these structures takes a long time to develop because daily price amplitude is very low.
Given this context, the US inflation report is almost irrelevant. In December, the Consumer Price Index remained unchanged, indicating a low probability of a Fed rate cut this month. No change means no strong reason for the market to buy or sell the dollar. Events related to Trump are increasingly ignored by market participants.
Overall Conclusions
Based on my analysis of EUR/USD, I conclude that the pair continues forming an upward trend segment. Donald Trump's policies and the Fed's monetary policy remain significant factors for long-term dollar weakness. Targets for the current trend segment may extend as far as the 25th level. The current upward wave set may already be complete, suggesting a possible near-term decline. The trend segment that began on November 5 could still take a five-wave shape, but at present it remains corrective.
At smaller timeframes, the full upward trend segment is visible. The wave count is not entirely standard, as corrective waves vary in size. For example, the larger wave 2 is smaller than the internal wave 2 within wave 3. Such discrepancies are not unusual. It is best to focus on clearly identifiable structures on the charts, rather than adhering strictly to every wave. The current upward structure is clear and unambiguous.
Key Principles of My Analysis:
- Wave structures should be simple and understandable. Complex structures are difficult to trade and often undergo changes.
- If there is uncertainty about market behavior, it is better to stay out.
- No analysis can guarantee the direction of movement. Always use protective Stop Loss orders.
- Wave analysis can be combined with other forms of analysis and trading strategies.
GBP/USD. Smart Money. Bulls Continue to Hesitate
.The GBP/USD pair remained virtually immobile on Tuesday, despite there being a multitude of trading cues for market participants. Late Monday night, it became known that a criminal case had been opened against Jerome Powell regarding excessive and unjustified spending on Fed building renovations, as well as knowingly false statements made to the US Congress. On Tuesday, the US inflation report was released, which, in my view, leaves open the possibility for more aggressive monetary easing in 2026 than the market currently anticipates. However, the policy rate is unlikely to change at the January FOMC meeting, which is supportive of the US dollar. Nevertheless, neither the dollar nor the euro, and neither bulls nor bears, currently have the willingness to move or trade. Market activity is minimal or extremely weak.
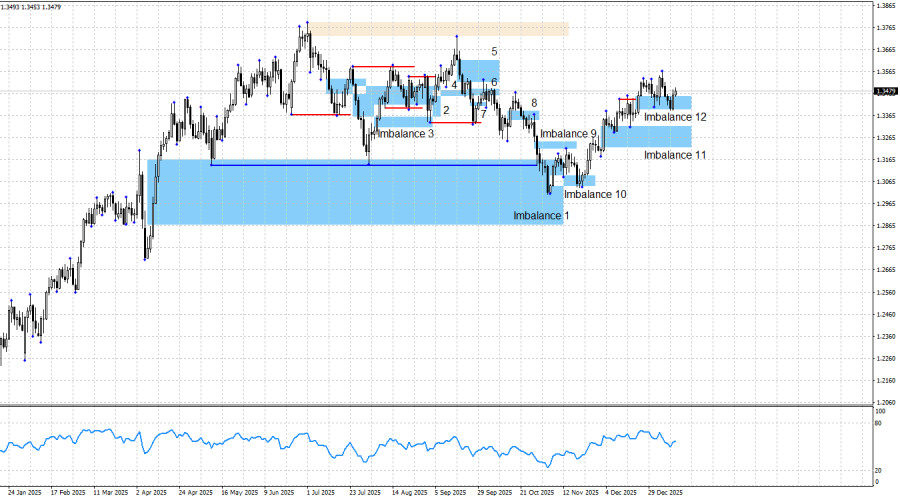
The Bullish Imbalance 12 remains the only viable pattern at the moment. If invalidated, it would not immediately cancel the bullish trend—it would only delay a renewed advance for the pound. However, a new bullish signal could still emerge within this pattern, as I warned last week. Bullish traders had to wait for support from Trump to launch a new advance, but traders themselves must remain proactive. Unfortunately, what we are seeing now is market passivity.
The chart picture is as follows: the bullish trend in GBP may be considered complete, but the bullish trend in EUR is not. Both the euro and the pound could generate new bullish signals in the near term, but given the current weak momentum, this is a challenging task. Donald Trump delivered another setback for the dollar, but traders responded only superficially. Therefore, I still expect the British pound to rise—but this growth will occur only if the market actively processes events, news, and reports.
On Tuesday, traders learned the level of December inflation and were disappointed that there were no changes compared to November. If inflation had accelerated, it could have indicated a more hawkish FOMC stance in early 2026. If inflation had slowed, a rate cut might have been expected as early as late January. The report showed neither scenario.
In the US, the overall information backdrop continues to suggest that nothing long-term is supportive for the dollar. The situation remains complex: the government shutdown lasted one and a half months, and Democrats and Republicans have agreed to fund only through the end of January, which is just three weeks away. US labor market statistics continue to disappoint. The last three FOMC meetings concluded with dovish decisions, and recent data suggest that the pause in monetary easing will not last long. Trump's military aggressions, threats toward Denmark, Mexico, Cuba, and Colombia, and the criminal investigation against Jerome Powell further reinforce the current picture in the US. In my view, bulls have every reason to launch a new advance and restore the pound to last year's peaks.
For a bearish trend to emerge, a strong and stable positive US news backdrop is required—something unlikely under Trump. Moreover, the US president does not want a strong dollar, as it would worsen the trade deficit. Therefore, I still do not believe in a bearish trend for GBP, despite the significant declines in September and October. Too many risk factors weigh on the dollar. How could bears push the pound further down if the current market context does not support a bearish trend? Potential declines could be reconsidered only if new bearish patterns appear—but none exist at present.
US and UK Economic Calendar:
- US – Producer Price Index (13:30 UTC)
- US – Retail Sales Change (13:30 UTC)
- US – Existing Home Sales (13:30 UTC)
On January 14, the economic calendar lists three releases, none of which are considered significant. The news backdrop will have a weak influence on market sentiment, mainly in the second half of the day.
GBP/USD Outlook and Trading Guidance:
The outlook for the pound remains favorable for traders. Four bullish patterns have already been worked through and generated signals, allowing traders to maintain long positions. I see no news-based reasons for a significant decline in GBP in the near term.
Renewal of the bullish trend could have been expected from Imbalance 1. To date, the pound has reacted to Imbalances 1, 10, 11, and 12. Today, another bullish signal may form within Imbalance 12. The potential upward target is 1.3725, though the pound could rise significantly higher in 2026. If bearish patterns emerge, the trading strategy may need adjustment, but at present there is no basis for such changes.
The material has been provided by InstaForex Company - www.instaforex.com.AUD/JPY. Analysis and Forecast.
.
The AUD/JPY pair has maintained its upward momentum for a third consecutive day, climbing to a new high since July 2024 in the 106.66–106.71 level. Current market dynamics are supported by fundamental factors suggesting that the short-term price direction remains bullish, albeit with the risk of a corrective pullback.
The Japanese yen remains under pressure amid persistent uncertainty over the timing of the Bank of Japan's next interest rate hike. Additional pressure stems from reports that Prime Minister Sanae Takaichi is prepared to call early parliamentary elections, which analysts believe could strengthen the government's position and pave the way for additional fiscal stimulus.

Expectations of stimulus measures have driven Japan's Nikkei 225 index to another record high, reducing the appeal of the yen as a safe-haven asset and thereby supporting the risk-sensitive Australian dollar.
The deepening diplomatic conflict between Tokyo and Beijing is also weighing on the yen. Last week, China imposed a ban on exports of several rare earth elements to Japan following renewed tensions over Taiwan. This decision has increased risks to supply chains for Japanese industrial companies and further weakened the fundamental outlook for the national currency.
At the same time, the Australian dollar is receiving support from expectations that the Reserve Bank of Australia (RBA) will maintain a hawkish stance on inflation and continue tightening monetary policy. Taken together, these factors form a persistently positive short-term outlook for the AUD/JPY pair. However, in the event of further yen weakness, market participants should remain mindful of the risk of intervention by Japanese authorities.

On Tuesday, Japan's Finance Minister Satsuki Katayama stated that she shares concerns over the one-sided weakness of the national currency. She noted that she had discussed the issue with US Treasury Secretary Scott Bessent, emphasizing that tolerance for yen depreciation has its limits.

These remarks have reinforced expectations of potential intervention by Japanese authorities in the foreign exchange market.
Despite this, ongoing expectations that the Bank of Japan will not abandon its course toward monetary policy normalization may deter yen sellers from aggressively increasing short positions. An additional limiting factor is the pair's moderate overbought condition on the daily chart. Nevertheless, a break above the 106.70 level and sustained consolidation above it confirm the strength of the bullish momentum, suggesting that corrective pullbacks are likely to be viewed as buying opportunities.
The material has been provided by InstaForex Company - www.instaforex.com.EUR/USD. Smart Money. The Fed Is Expected to Keep Monetary Policy Parameters Unchanged
.The EUR/USD pair declined for eleven consecutive days and has now spent the last two sessions undecided about its next direction. During this decline, the bullish Imbalance 9 was fully worked through with a margin. Since this pattern has not yet been invalidated, I continue to believe that the bullish trend remains intact.In my view, bulls could have launched a new advance as early as last week, when most US economic data came in disappointing. However, bears stubbornly continued to press lower. An attempt to resolve the situation came late Monday night, when a criminal investigation was opened against Jerome Powell. Traders clearly understand who should be credited for this and what it implies. Powell himself stated that holding an independent opinion in the United States is becoming dangerous, and that the sole reason for his prosecution is his refusal to cut interest rates to the levels demanded by the US president. Neither this event nor today's inflation report managed to wake up market participants.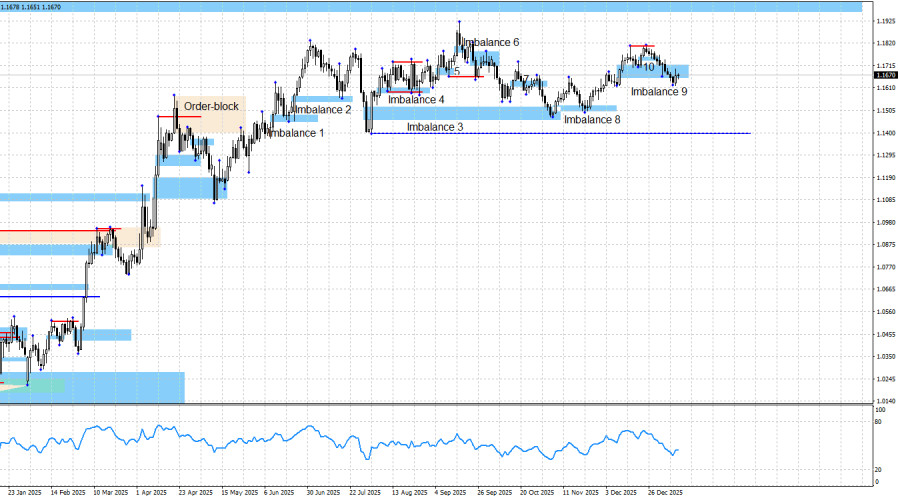
The US dollar began to decline on Monday's news but almost immediately ended the move. I continue to expect a bullish reaction from Imbalance 9 unless this pattern is invalidated, which would force a reassessment of the bullish impulse. At present, however, market activity is extremely weak. The news flow is present, but price movement is not. Invalidation would occur below 1.1616. This would not automatically turn the trend bearish, but it could allow bears to seize the initiative for a period of time.
The chart picture continues to signal bullish dominance. The bullish trend remains in place, but traders currently need fresh signals. Such a signal can only be formed within Imbalance 9, yet none has emerged so far. Should bearish patterns appear or bullish ones be invalidated, the trading strategy would need to be adjusted. At the moment, however, none of this is happening. There are no new patterns at all, as market movements remain extremely weak.
Tuesday's information backdrop was dominated by the US inflation report. The Consumer Price Index rose to 2.7% in December, matching both trader expectations and the previous month's reading. Core CPI came in at 2.6%, also in line with expectations and unchanged from the prior month. One of those cases where higher inflation might actually have been preferable. As a result, the Federal Reserve is now expected, with a 99% probability, to keep its monetary policy parameters unchanged at the end of the month.
Bullish traders have had sufficient reasons for a renewed advance for the past four to five months, and all of them remain valid. These include the (at least) dovish outlook for FOMC monetary policy, Donald Trump's overall policy stance (which has not changed recently), the ongoing US–China confrontation (where only a temporary truce has been reached), public protests in the US against Trump under the "No Kings" banner, weakness in the labor market, the unpromising outlook for the US economy (recession risks), and the government shutdown, which lasted a month and a half but was largely ignored by traders. Added to this are US military actions against certain countries and the criminal prosecution of Powell. Consequently, further growth in the pair appears fully justified in my view.
I still do not believe in a bearish trend. The news backdrop remains extremely difficult to interpret in favor of the US dollar, which is why I do not attempt to do so. The blue line marks the price level below which the bullish trend could be considered complete. Bears would need to push the price down by roughly 300 points to reach it, a task I consider unachievable under the current news environment and circumstances. The nearest upward target for the euro remains the bearish imbalance at 1.1976–1.2092 on the weekly chart, which was formed back in June 2021.
US and Eurozone Economic Calendar:
- US – Producer Price Index (13:30 UTC)
- US – Retail Sales Change (13:30 UTC)
- US – Existing Home Sales (13:30 UTC)
January 13 features three economic releases, none of which can be considered significant. The impact of the news backdrop on market sentiment on Wednesday, particularly in the second half of the day, is expected to be limited.
EUR/USD Outlook and Trading Guidance:
In my opinion, the pair may be approaching the final stage of the bullish trend. Although the news backdrop continues to favor bulls, bears have been more active in recent months. Nevertheless, I see no realistic reasons for the start of a bearish trend.
From Imbalances 1, 2, 4, and 5, traders had opportunities to buy the euro, and each time the market showed a degree of growth. Opportunities to open new trend-following long positions also emerged after reactions to Bullish Imbalance 3, then after Imbalance 8, and later after the rebound from Imbalance 9. This week, a second reaction to Bullish Imbalance 9 may still occur. The upward target for the euro remains 1.1976.
New long positions remain acceptable if a fresh bullish signal is formed. If not, the buying strategy will need to be reconsidered.
The material has been provided by InstaForex Company - www.instaforex.com.XAU/USD: Analysis and Forecast
.
Gold remains under pressure on Tuesday, trading near the psychological $4,600 level after reaching a new all-time high in the previous session. Despite the short-term correction, the fundamental backdrop remains favorable for the precious metal. The recovery of the US dollar following yesterday's decline is acting as a key constraint on further upside in the XAU/USD pair. However, the potential for sustained dollar strength is limited by growing concerns over the independence of the US Federal Reserve.
An investigation initiated by the administration of Donald Trump into Federal Reserve Chair Jerome Powell has increased uncertainty surrounding the Fed's independence and has become one of the drivers supporting gold as a safe-haven asset. In a public statement, Powell described the situation as unprecedented, noting that he views the investigation as a response to the central bank's refusal to cut interest rates despite pressure from the White House.
Geopolitical tensions remain an additional source of support. Recent statements by Trump regarding the possibility of military action against Iran in response to the violent suppression of protests, along with the threat of imposing 25% tariffs on imports from countries cooperating with Tehran, have boosted demand for safe-haven assets. As a result, gold reached new record highs earlier this week.
Nevertheless, the metal's short-term price dynamics will depend on the release of US consumer inflation data later today. The consensus forecast expects the headline Consumer Price Index (CPI) to rise by 0.3% month-on-month, while the annual rate is seen holding steady at 2.7%. Core CPI, which excludes food and energy prices, is also expected to remain close to 2.7% year-on-year.
Any significant deviation from these expectations could influence market forecasts regarding the Federal Reserve's policy decision at its January 28 meeting. At the same time, market participants continue to price in two Fed rate cuts in 2026, which limits demand for the US dollar and supports interest in gold.
From a fundamental perspective, declining yields on US assets and persistent geopolitical uncertainty continue to create a favorable environment for the precious metal. Any corrective pullbacks are likely to be viewed by investors as buying opportunities, while the broader trend remains bullish.
From a technical standpoint, strong support is seen near the corrective pullback area around 4,560, while resistance is located at the psychological 4,600 level. Oscillators remain positive but are approaching overbought territory, suggesting continued bullish bias accompanied by consolidation or a potential pullback.
The material has been provided by InstaForex Company - www.instaforex.com.Weekly Forecast Based on Simplified Wave Analysis for GBP/USD, AUD/USD, USD/CHF, EUR/JPY, AUD/JPY, and EUR/CHF on January
.GBP/USD
Analysis:
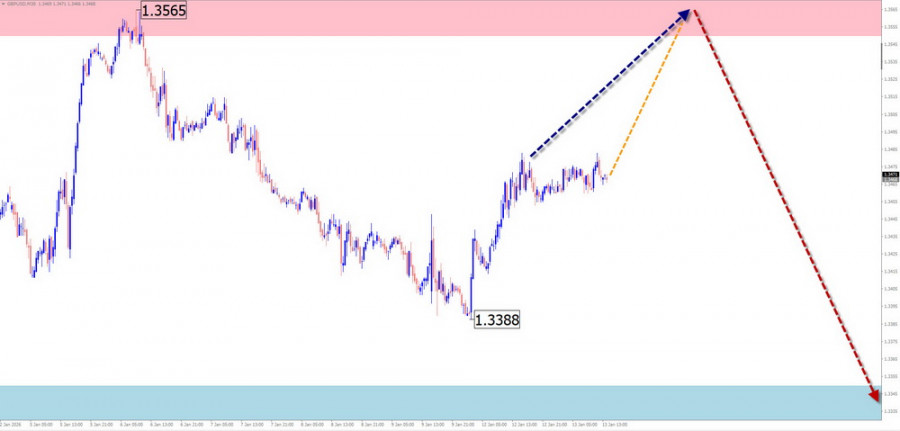
On the chart of the main British pound pair, the short-term trend has been driven by an upward wave algorithm since the beginning of last year. Within its structure, a corrective move is currently developing as part of the final wave (C). Prices are approaching the lower boundary of the potential reversal zone.
Forecast:
In the first half of the week, the bullish price movement of the pound is expected to continue until resistance levels are tested. A sideways trading phase along the zone boundaries is likely thereafter. Toward the weekend, increased volatility may emerge, followed by a trend reversal and a resumption of price declines. The downward move is expected to be limited by the projected support level.
Potential Reversal Zones
Resistance:
- 1.3510–1.3560
Support:
- 1.3350–1.3300
Recommendations:
- Buy positions: Limited upward potential and a high risk of losses.
- Sell positions: May be considered after the completion of the upward correction and the emergence of confirmed reversal signals near the resistance zone.
AUD/USD
Analysis:
On the Australian dollar chart against the US dollar, the most notable feature is the unfinished bullish wave pattern originating on September 30 of last year. Price has reached the lower boundary of a major higher-timeframe potential reversal zone. A corrective move is forming within the final wave (C).
Forecast:
Over the next 24 hours, further upward movement is expected, followed by a transition into sideways price action along resistance boundaries. After potential pressure on this zone, a reversal formation may occur. The start of a price decline is more likely toward the end of the week. The downward range is expected to remain above the projected support level.
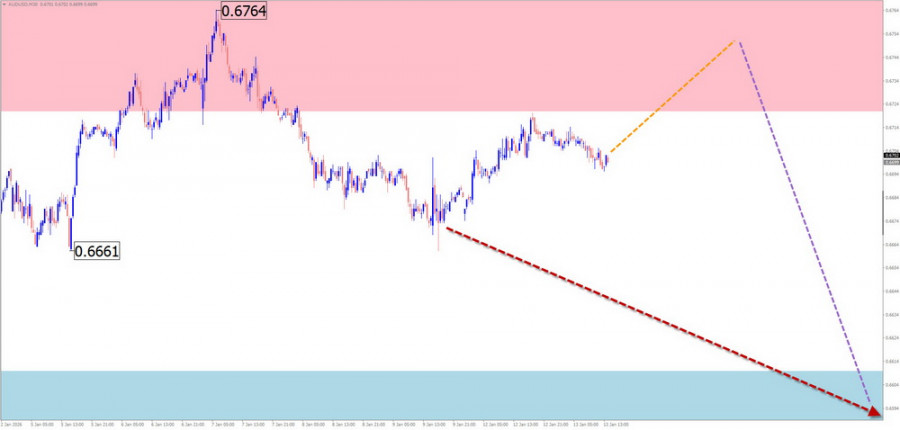
Potential Reversal Zones
Resistance:
- 0.6720–0.6770
Support:
- 0.6610–0.6560
Recommendations:
- Buy positions: Low upward potential and increased risk of losses.
- Sell positions: May be used in fractional position sizing after reversal signals appear near resistance.
USD/CHF
Analysis:
Since April of last year, Swiss franc quotes on the major pair have continued to form an ascending range. Within its structure, the intermediate wave (B) has been developing over recent months and has not yet reached completion. Price remains confined within a narrow horizontal corridor between opposing zones of different scales.
Forecast:
Over the coming week, sideways movement is expected to persist. A short-term downward correction may occur during the first few days, followed by a possible reversal and a resumption of upward movement. In the event of a trend shift, a brief break below the lower boundary of the support zone cannot be ruled out.
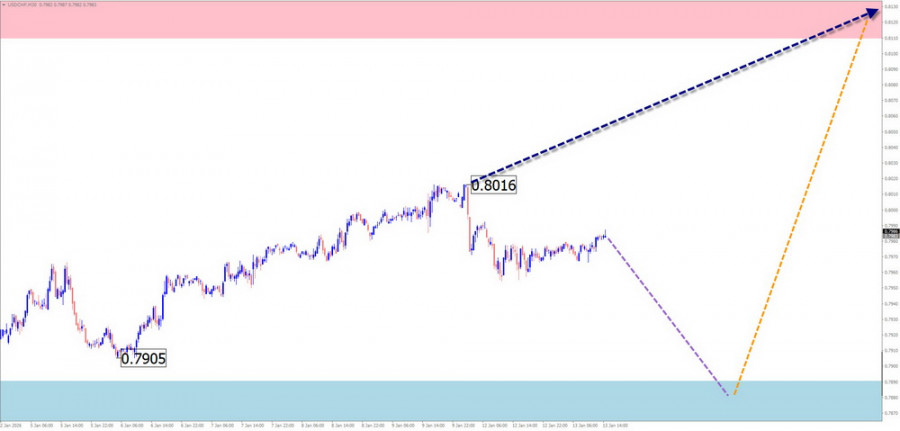
Potential Reversal Zones
Resistance:
- 0.8110–0.8160
Support:
- 0.7890–0.7840
Recommendations:
- Sell positions: Limited potential and elevated risk.
- Buy positions: May be considered after confirmed reversal signals appear near the support zone.
EUR/JPY
Analysis:
Since the end of February last year, an ascending wave structure has been developing on the EUR/JPY pair. On the weekly timeframe, this wave initiated a new leg of the primary trend. Price has reached the lower boundary of a strong potential reversal zone. At present, there are no clear signals of an imminent reversal.
Forecast:
In the first half of the coming week, further price growth is expected, potentially reaching projected resistance levels. A reversal and trend change are more likely closer to the weekend. The decline in prices is expected to be limited by the projected support zone.
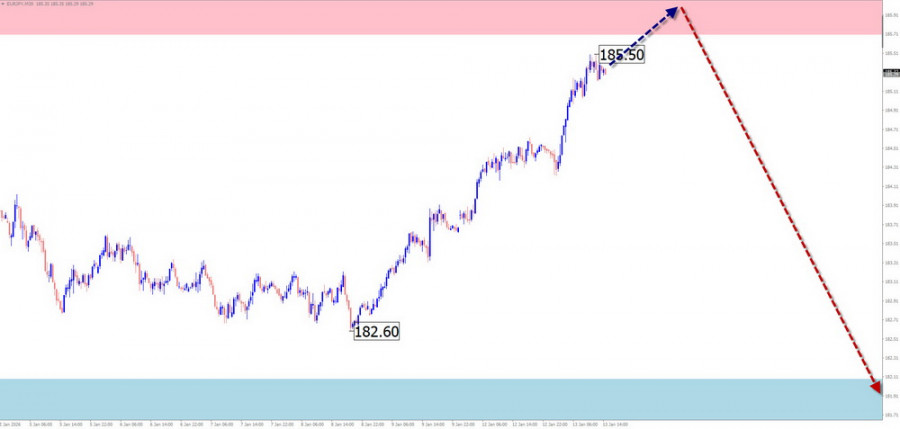
Potential Reversal Zones
Resistance:
- 185.70–186.20
Support:
- 182.10–181.60
Recommendations:
- Buy positions: Risky due to limited upward potential.
- Sell positions: May be considered once confirmed reversal signals appear near resistance.
AUD/JPY
Brief Analysis:
Since April of last year, short-term price movements in the AUD/JPY pair have been guided by an upward wave algorithm. At the time of analysis, price is trading within a strong reversal zone and approaching its upper boundary. The wave structure does not yet indicate completion, suggesting the need for a corrective move.
Weekly Forecast:
Over the next couple of days, pressure on the resistance zone is possible, followed by sideways consolidation along the zone. In the second half of the week, a reversal may form, leading to a downward move toward projected support levels.
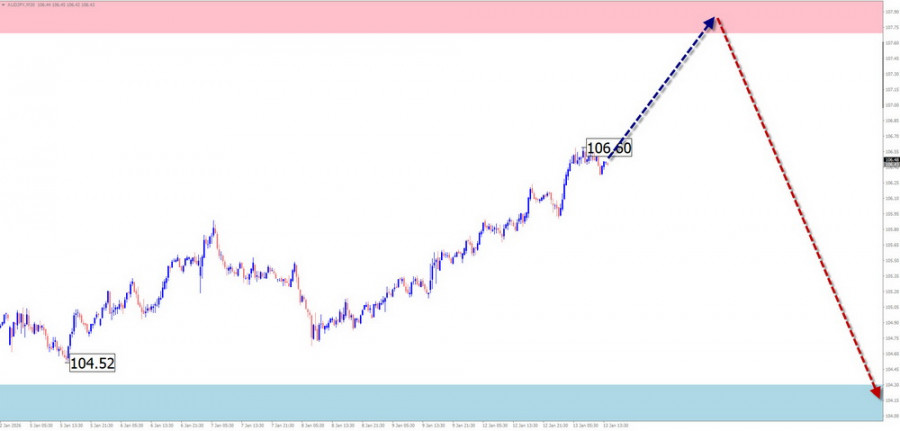
Potential Reversal Zones
Resistance:
- 107.70–108.20
Support:
- 104.30–103.80
Recommendations:
- Buy positions: Limited upward potential and elevated risk of losses.
- Sell positions: May become viable after confirmed reversal signals appear near the resistance zone.
EUR/CHF
Brief Analysis:
On the EUR/CHF pair chart, the downward wave that began in March of last year continues to form. Since mid-November, prices have been correcting, creating a countertrend correction. Its structure does not yet appear complete.
Weekly Forecast:
During the upcoming week, sideways movement is expected to dominate. A short-term decline toward the support zone cannot be ruled out over the next few days. A renewed upward bias is more likely closer to the weekend.
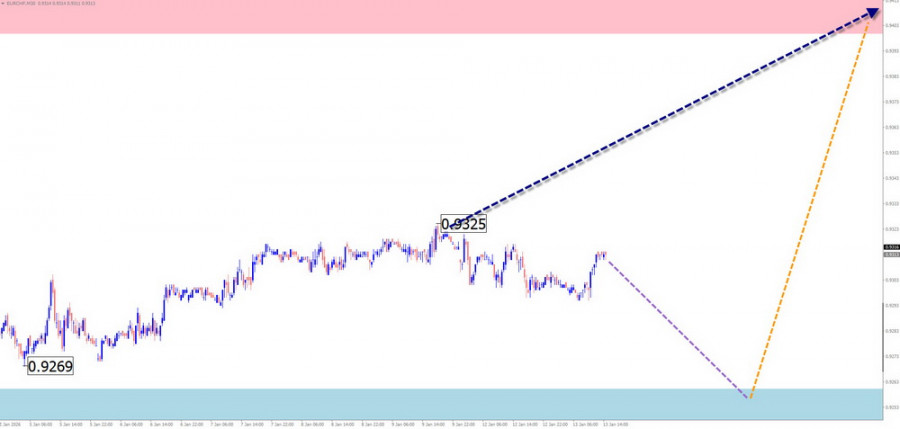
Potential Reversal Zones
Resistance:
- 0.9400–0.9450
Support:
- 0.9260–0.9210
Recommendations:
- Buy positions: May be considered after confirmed reversal signals emerge.
- Sell positions: Limited potential and elevated risk.
Notes:
In simplified wave analysis (SWA), all waves consist of three parts (A–B–C). On each timeframe, the most recent unfinished wave is analyzed. Expected price movements are indicated by dashed lines.
Warning:
The wave algorithm does not take the time duration of price movements into account.
The material has been provided by InstaForex Company - www.instaforex.com.USD/JPY: Analysis and Forecast
.
Today, the Japanese yen weakened sharply, despite the lack of strong global demand for the US dollar.
Reports that Japanese Prime Minister Sanae Takaichi may call early parliamentary elections in the first half of February have fueled expectations of a possible expansion of fiscal stimulus. Such measures would likely aim to strengthen the ruling coalition's position in parliament and maintain political stability. These speculations are adding pressure on the yen, as markets assess the likelihood of additional economic support measures.
At the same time, rising geopolitical tensions with China are creating new risks for Japan's industrial sector. Last week, Beijing imposed a ban on exports of certain rare earth metals to Japan following an escalation in diplomatic tensions over Taiwan. This decision threatens supply chains for key components used by Japanese manufacturers and increases uncertainty surrounding the future of trade relations between the two countries.
Despite the relatively hawkish stance of the Bank of Japan, investors remain uncertain about the timing of the next interest rate hike. Combined with sustained risk appetite, this limits demand for the Japanese yen as a safe-haven asset.

An additional source of pressure came from Finance Minister Satsuki Katayama, who stated on Tuesday that she is concerned about the one-sided weakening of the yen. She noted that she had already discussed the issue with US Treasury Secretary Scott Bessent, emphasizing that there are limits to how much the national currency can weaken.

On the other hand, concerns over the independence of the US Federal Reserve have resurfaced. On Monday, reports emerged about the launch of a criminal investigation into Fed Chair Jerome Powell. In response, Powell called the investigation unprecedented and stated that it was initiated due to President Donald Trump's dissatisfaction with the Fed's refusal to accelerate interest rate cuts, despite public pressure.
This situation is restraining US dollar strength, although the latest labor market data released on Friday supported expectations of a more cautious approach by the Federal Reserve toward policy easing. Markets are currently pricing in two potential Fed rate cuts in 2026, while the Bank of Japan continues on a path of gradual monetary policy normalization. Last week, BoJ Governor Kazuo Ueda confirmed that the central bank is prepared to continue raising rates if economic and price trends align with its forecasts.
 .
.
This divergence in monetary policy between the two central banks is likely to limit the upward potential of the USD/JPY pair. Investors may therefore adopt a wait-and-see approach, awaiting additional signals regarding the future trajectory of Fed interest rates.
In the coming days, US inflation data—particularly today's release of the Consumer Price Index (CPI)—will serve as a key market driver. These figures may influence short-term US dollar dynamics and determine the direction of the USD/JPY pair.
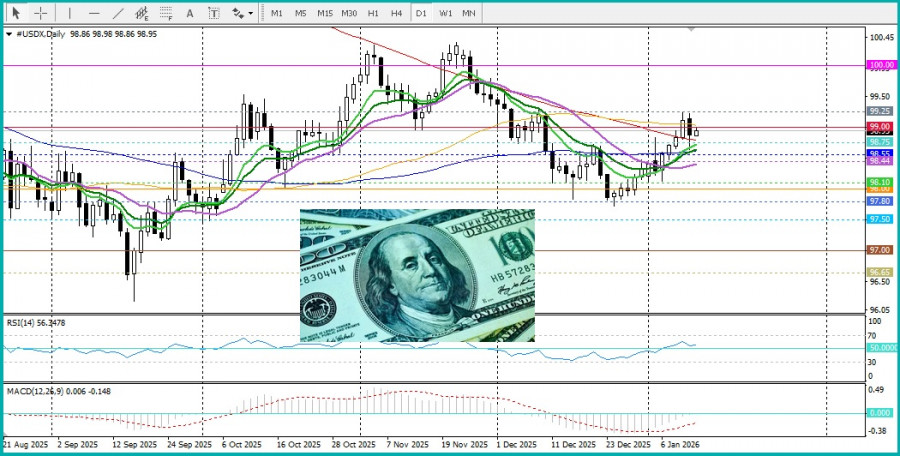
From a technical perspective, oscillators remain positive, confirming the pair's bullish bias. However, it is worth noting that the Relative Strength Index (RSI) is approaching overbought territory, signaling the possibility of an imminent correction or consolidation. The pair has found solid support at the psychological level of 158.00, while resistance stands at 158.86. A break above this level could open the way toward the 2024 highs.
The material has been provided by InstaForex Company - www.instaforex.com.Weekly Forecast Based on Simplified Wave Analysis for EUR/USD, USD/JPY, GBP/JPY, USD/CAD, EUR/GBP, and Gold — January 13th
.EUR/USD
Analysis
Within the broader bullish wave of the euro major, which has been unfolding since the beginning of last year, the pair's quotes have spent the past six months moving along the lower boundary of a strong potential reversal zone. At the time of analysis, the wave structure does not appear complete. Over the past three weeks, a corrective pullback to the downside has been developing.
Forecast
In the near term, continued sideways movement of the euro is expected. Following a probable attempt to test the lower reversal zone, a change in direction and a rise toward the resistance area may occur. During the directional shift, a brief break below the lower boundary of the projected support cannot be ruled out.
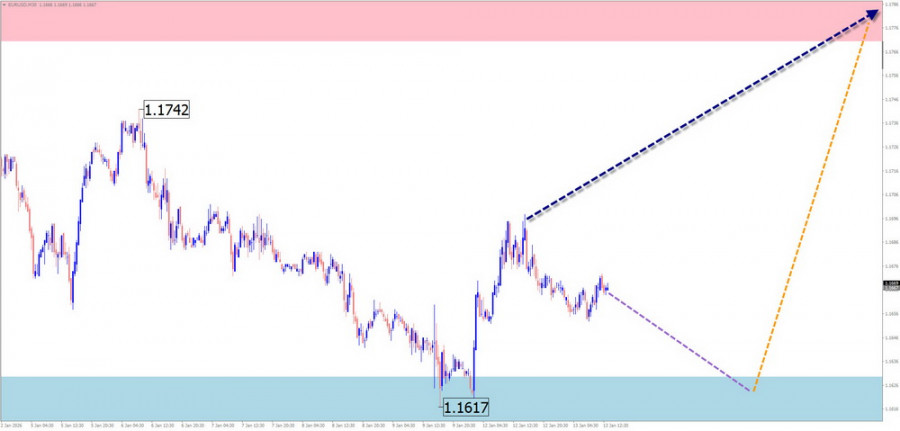
Potential Reversal Zones
Resistance:
- 1.1770–1.1820
Support:
- 1.1630–1.1580
Recommendations
Sell positions: fairly risky and may lead to deposit losses.Buy positions: may become viable after confirmed reversal signals appear on the trading systems you use near the support area.
USD/JPY
Analysis
Since October of last year, the Japanese yen major has mostly been moving higher, forming an extended ascending flat. The wave structure lacks its final segment (C). In recent weeks, a corrective pullback has been forming from an intermediate resistance zone, predominantly in a sideways manner.
Forecast
Over the coming week, there is a high probability that the overall sideways price movement will persist. In the first few days, short-term pressure on the resistance zone is possible, after which a change in direction and the start of a decline may follow. The support area marks the lower boundary of the pair's preliminary weekly range.
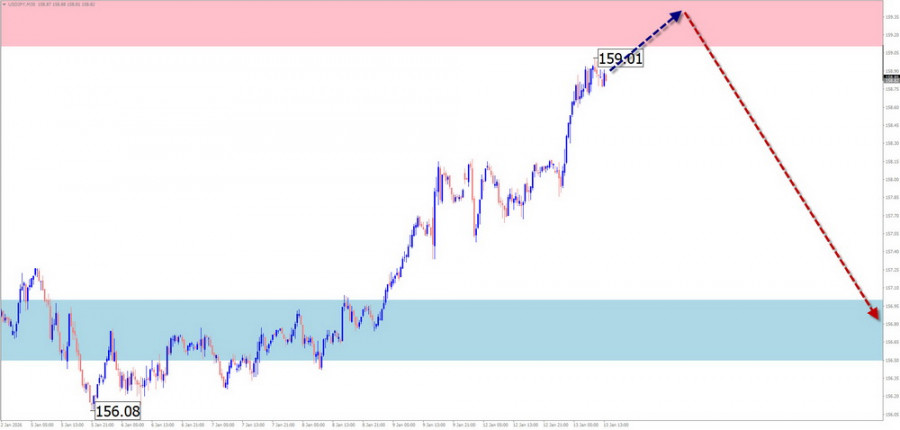
Potential Reversal Zones
Resistance:
- 159.10–159.60
Support:
- 157.00–156.50
Recommendations
Buy positions: fairly risky and may result in deposit losses.Sell positions: after confirmed reversal signals appear, small position sizes may be used to seek profits.
GBP/JPY
Analysis
On the GBP/JPY pair chart, the short-term trend direction has been defined by a bullish wave that began on November 5 of last year. This price segment completes a larger-scale wave structure. At present, the price has reached the lower boundary of a strong potential reversal zone on a higher timeframe.
Forecast
During the current week, the ongoing upward price movement is expected to complete. Before a trend reversal, pressure on the upper boundary of the resistance zone is possible over the next couple of days. An increase in volatility and the start of an active price decline are more likely toward the end of the week.
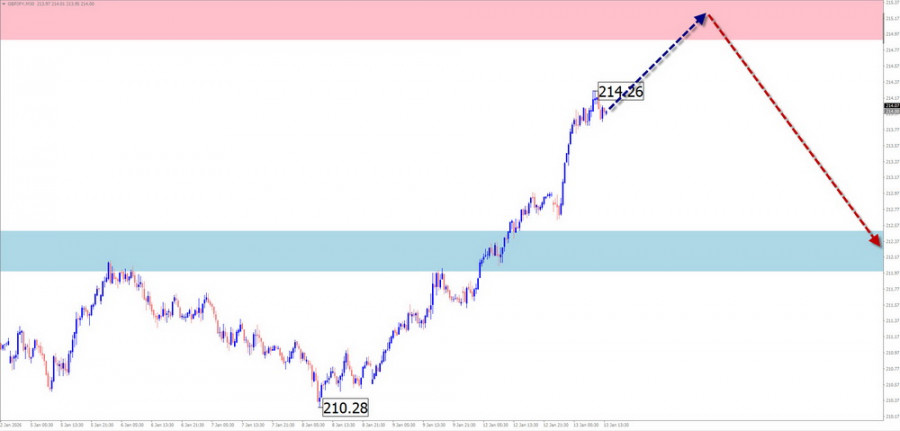
Potential Reversal Zones
Resistance:
- 214.90–215.40
Support:
- 212.50–212.00
Recommendations
Buy positions: risky and may be unprofitable.Sell positions: may be used after appropriate reversal signals appear near the resistance area.
USD/CAD
Analysis
The primary direction of price fluctuations in the Canadian dollar major has been defined by a descending wave algorithm since February of last year. The unfinished segment of the main trend began on November 5. Since late December, a counter-wave structure has been developing, remaining within corrective boundaries.
Forecast
At the beginning of the upcoming week, there is a high probability that the overall sideways price bias will persist. Pressure on the upper boundary of the projected resistance cannot be ruled out. With high probability, a reversal may then form, followed by a price decline toward the support zone.
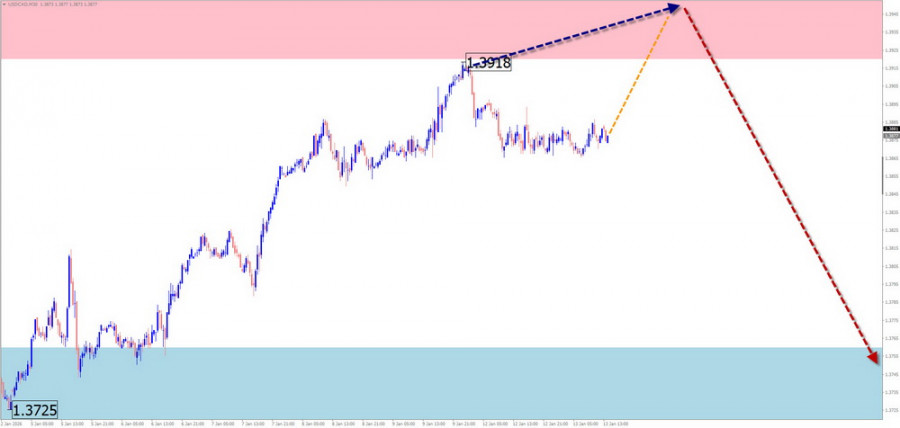
Potential Reversal Zones
Resistance:
- 1.3920–1.3970
Support:
- 1.3760–1.3710
Recommendations
Buy positions: have limited potential and carry a high level of risk.Sell positions: may become viable after appropriate reversal signals appear near the resistance area on the trading systems you use.
EUR/GBP
Analysis
The current wave structure of the EUR/GBP pair is bearish and has been unfolding since April of last year. Since October, the pair has been trading in a range, forming the initial phase of the final wave segment (C). Quotes are confined to a narrow channel between strong potential reversal zones on the daily timeframe.
Forecast
In the coming days, continued sideways movement can be expected. Near the support zone, a reversal is likely to form, followed by a resumption of upward movement. The highest activity is most likely closer to the weekend.
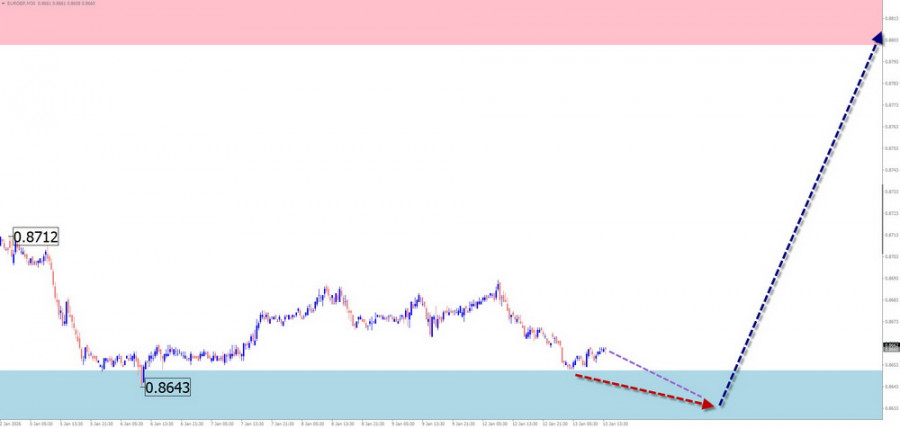
Potential Reversal Zones
Resistance:
- 0.8800–0.8850
Support:
- 0.8650–0.8600
Recommendations
Buy positions: may be opened in fractional size after reversal signals appear near the support zone. Upward potential is limited by the resistance area.Sell positions: unpromising and risky.
Gold
Analysis
Gold prices are renewing the record highs seen at the end of last year. Within a larger wave structure, following a hidden correction, this segment has initiated another trend phase. A corrective pullback in the form of an extended flat is currently forming and remains unfinished at the time of analysis.
Forecast
Over the coming week, there is a high probability that the overall sideways price bias will persist. In the first few days, pressure on the lower boundary of the support zone is possible. Thereafter, with high probability, a reversal may form, followed by the start of a decline. The expected downside range is capped by the projected resistance.
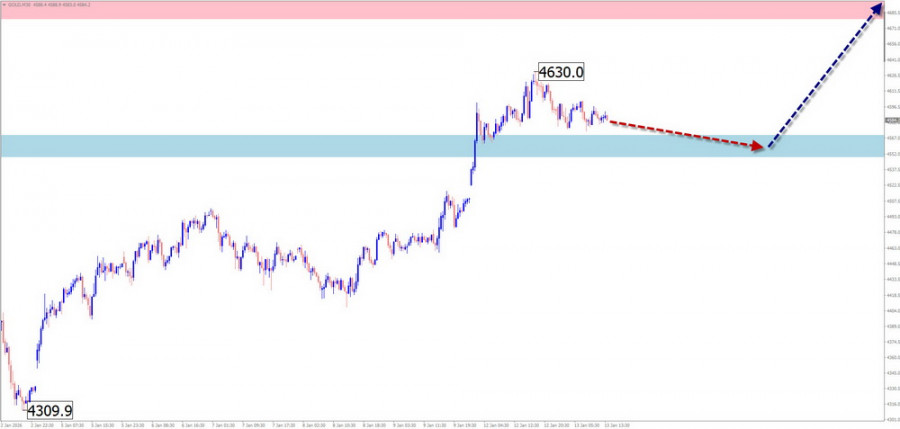
Potential Reversal Zones
Resistance:
- 4680.0–4700.0
Support:
- 4570.0–4550.0
Recommendations
Buy positions: have limited potential and carry a high level of risk.Sell positions: may become viable after appropriate reversal signals appear near the projected support zone on the trading systems you use.
Explanations
In simplified wave analysis (SWA), all waves consist of three segments (A–B–C). On each timeframe, the most recent unfinished wave is analyzed. Dotted lines indicate expected price movements.
Attention
The wave algorithm does not take the duration of price movements over time into account.
The material has been provided by InstaForex Company - www.instaforex.com.GBP/JPY: Analysis and Forecast
.
The GBP/JPY pair continues to build on the bullish momentum that emerged after breaking out of a nearly three-week trading range and is extending gains for a third consecutive day on Tuesday. Spot prices have reached a new high not seen since August 2008, with buyers attempting to secure a foothold above the 214.00 level amid broad-based weakness in the Japanese yen.
Additional support for the pound comes from Japan's domestic political backdrop. Reports suggesting that Prime Minister Sanae Takaichi may soon call a snap election have boosted expectations of a potential expansion in fiscal stimulus. This development coincides with persistent uncertainty over the timing of the Bank of Japan's next interest rate hike, as well as escalating diplomatic tensions between Tokyo and Beijing, all of which continue to weigh on the yen.
Moreover, the ongoing positive sentiment across global equity markets is reducing demand for safe-haven assets and undermining the yen's status as a refuge currency, further supporting gains in the GBP/JPY pair. That said, bearish sentiment toward the yen remains somewhat capped by expectations of potential intervention by Japanese authorities to stabilize the national currency.
On Tuesday, Japan's Finance Minister Satsuki Katayama stated that she shares concerns over the yen's recent sharp depreciation, noting that she discussed the issue with U.S. Treasury Secretary Scott Bessent. She emphasized that tolerance for excessive weakness in the national currency has its limits. However, the Bank of Japan's cautious stance continues to reinforce the prevailing yen-selling trend, paving the way for a potential extension of the pair's advance.
Meanwhile, the British pound is receiving additional support from a lack of pronounced demand for the U.S. dollar, which further strengthens the positive short-term outlook for the pair.
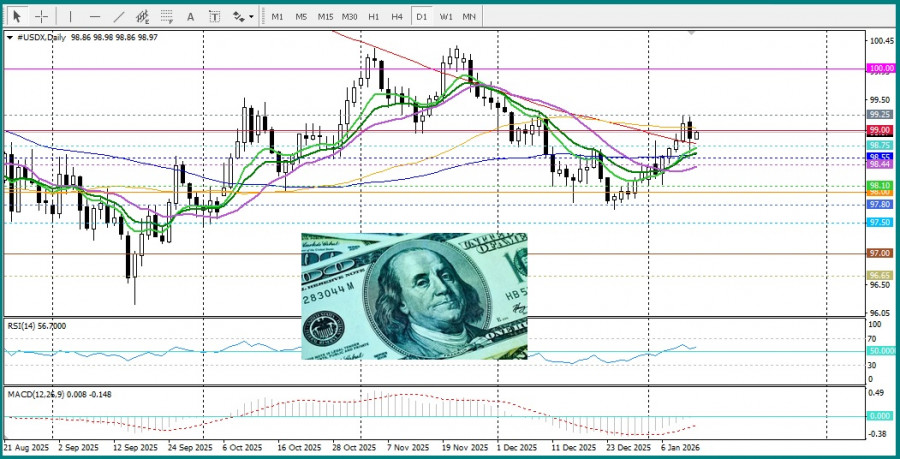
A sustained break above the previous multi-year high near 212.15, reached last week, confirms the bullish scenario. From a technical perspective, the daily Relative Strength Index (RSI) is in overbought territory, suggesting that buyers should exercise caution, as a period of consolidation cannot be ruled out.
Traders' attention is now likely to turn to the upcoming release of UK GDP data, scheduled for Thursday. News flow from both the UK and Japan may provide fresh directional cues for the pair, particularly against the backdrop of expectations for two potential interest rate cuts by the Bank of England in 2026.
The material has been provided by InstaForex Company - www.instaforex.com.Market stands behind Fed
.Investors took the lawsuit against Jerome Powell in stride, allowing the S&P 500 to hit a new record high
Fear is often exaggerated. Concerns that the suit could ignite a renewed "sell America" trade over threats to Fed independence—if the central bank, at the White House's behest, began aggressively loosening policy, leading to runaway inflation and a double?dip recession—did not materialize in market panic. In practice, the broad index reacted fairly calmly to the threat.
The Fed's independence remains sacrosanct for equity markets. Investors understand that several months remain before Jerome Powell would leave the Fed chairmanship. The suit against him matters less than the court verdict in the Lisa Cook case on January 21. If the White House succeeds in removing the FOMC governor, it would set a precedent. Donald Trump's chances of flooding the Committee with "doves" would rise, along with the probability of aggressive federal funds rate cuts.
Dynamics of US Stock Indices
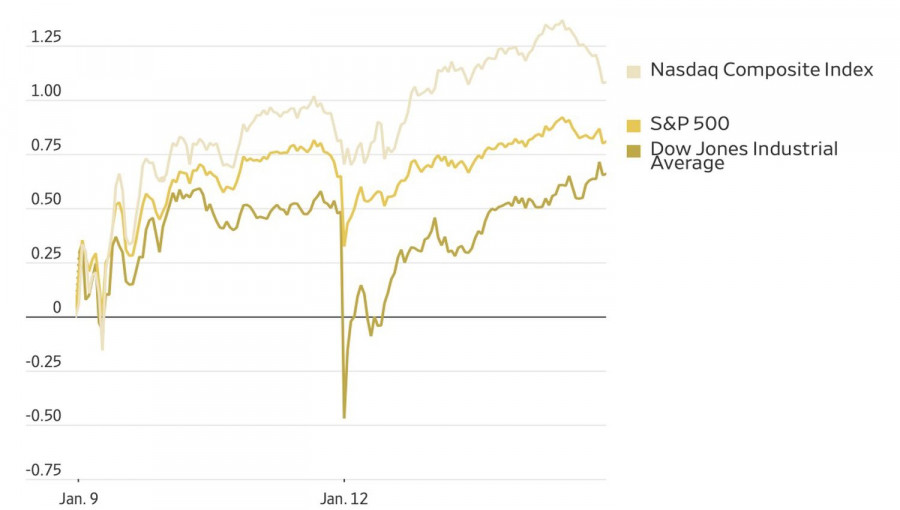
Former Fed chairs backed Jerome Powell. Alan Greenspan, Ben Bernanke, and Janet Yellen warned that White House intervention in monetary policy would end badly. Experience in other, mainly emerging, economies proves the point: Argentina, Turkey, and many others tried fiscal dominance and ended up ruined. Their economies were shaken by sky?high inflation and currency crises.
Markets do not believe this could happen in the United States. The Fed is not a one?man show, and decisions are made collectively. Moreover, attacks on Powell could backfire. After his term as chair expires, he could remain on the FOMC, as the law allows.
According to JP Morgan, investors are not easily frightened. Any escalation of conflict between the White House and the Fed, the bank says, is a good excuse to buy the S&P 500 on a pullback. Small?caps look even better at the start of the year.
Russell 2000 Lead Days vs S&P 500
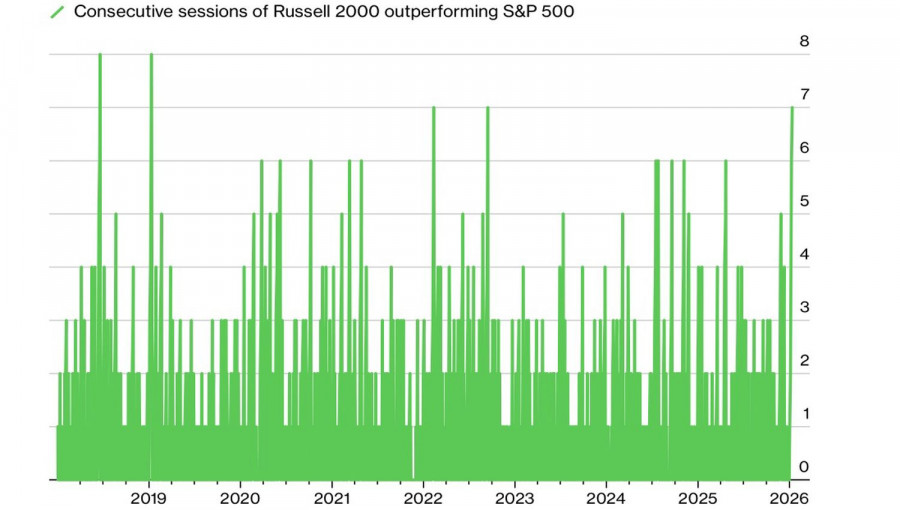
Russell 2000 has outperformed the broad index for seven consecutive days, something not seen since early 2019. Then the US market was recovering from late?2018 sell?offs. Today, rotation is in full swing. Investors are shedding mega?cap tech names and buying sectors sensitive to the health of the US economy.
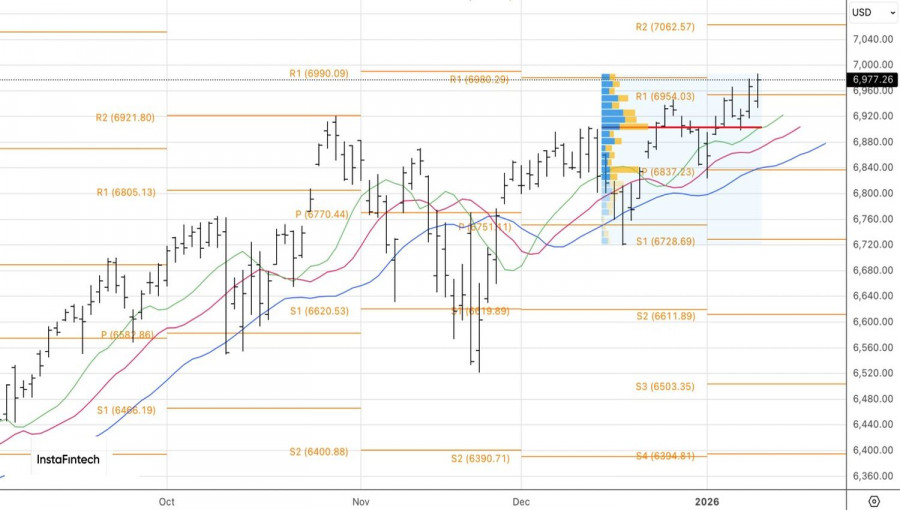
The market is preparing for the release of December inflation data in the US, which will clarify the Fed's stance.
Technically, the daily chart shows that the S&P 500 continues an uphill march. Long positions opened at 6,931 and below should be held and occasionally increased. As long as the broad index trades above fair value at 6,900, sentiment remains bullish.
The material has been provided by InstaForex Company - www.instaforex.com.USD/JPY: Tips for Beginner Traders — January 13th (US Session)
.Trade Review and Trading Advice for the Japanese Yen
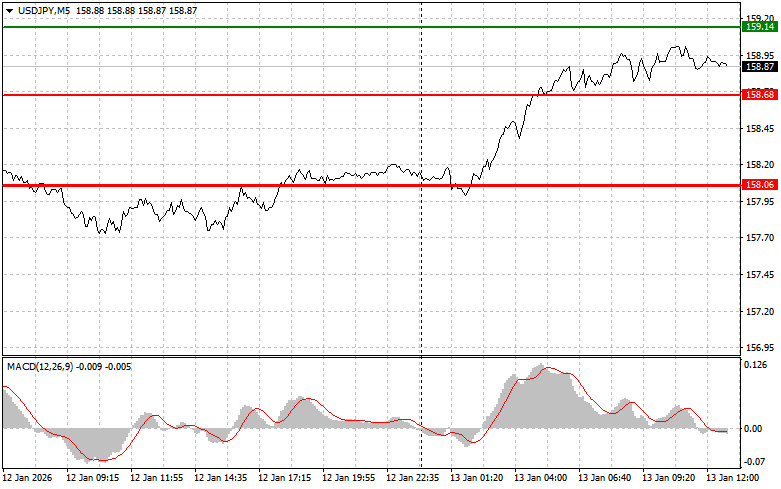
No tests of the marked levels occurred during the first half of the day.
It appears that the market has already digested the possibility of a dissolution of the Japanese government, while statements from central bank officials helped limit further losses in the Japanese yen during the first half of the session. Market participants are now closely watching the upcoming inflation data. If actual inflation exceeds expectations, it could strengthen the case for a more restrictive interest rate policy in the United States. Conversely, more moderate price growth would give the Federal Reserve greater flexibility to ease its current policy, which could put pressure on the US dollar against the yen.
US new home sales will also be closely monitored, as this indicator is a key gauge of the health of the housing market and overall economic activity. Stable sales figures could point to resilience in the housing sector. A speech by Federal Open Market Committee member Alberto Musalem is unlikely to significantly shift market sentiment in USD/JPY, but it will still be analyzed for clues regarding his view of the current economic situation and interest rate outlook.
As for intraday trading strategy, I will primarily rely on the execution of Scenario No. 1 and Scenario No. 2.
Buy Signal
Scenario No. 1
I plan to buy USD/JPY today if the price reaches the entry level around 159.03 (green line on the chart), targeting a move toward 159.58 (thicker green line on the chart). Around 159.58, I plan to exit long positions and consider opening short positions in the opposite direction, aiming for a 30–35 point move from that level. Further upside can be expected in line with the prevailing trend.
Important: Before buying, make sure the MACD indicator is above the zero line and just beginning to rise from it.
Scenario No. 2
I also plan to buy USD/JPY today if there are two consecutive tests of the 158.75 level while the MACD is in oversold territory. This would limit the pair's downward potential and trigger a reversal to the upside. A move toward the opposite levels of 159.03 and 159.58 can be expected.
Sell Signal
Scenario No. 1
I plan to sell USD/JPY today after a break below the 158.75 level (red line on the chart), which could lead to a sharp decline in the pair. The key downward target for sellers will be 158.20, where I plan to exit short positions and immediately open long positions in the opposite direction, aiming for a 20–25 point rebound. Selling pressure may return today if the Federal Reserve adopts a dovish stance.
Important: Before selling, make sure the MACD indicator is below the zero line and just beginning to decline from it.
Scenario No. 2
I also plan to sell USD/JPY today if there are two consecutive tests of the 159.03 level while the MACD is in overbought territory. This would cap the pair's upward potential and trigger a reversal to the downside. A decline toward the opposite levels of 158.75 and 158.20 can be expected.
Chart Explanation
- Thin green line — Entry price for buying the instrument
- Thick green line — Projected take-profit level, where profits may be locked in, as further upside above this level is unlikely
- Thin red line — Entry price for selling the instrument
- Thick red line — Projected take-profit level, where profits may be locked in, as further downside below this level is unlikely
- MACD indicator — When entering trades, it is important to consider overbought and oversold zones
Important Notice for Beginner Traders
Beginner Forex traders should be extremely cautious when making market-entry decisions. Ahead of major fundamental releases, it is best to stay out of the market to avoid sharp price fluctuations. If you choose to trade during news releases, always use stop-loss orders to minimize potential losses. Without stop-loss protection, you can lose your entire deposit very quickly—especially if you do not apply proper money management and trade large position sizes.
Finally, remember that successful trading requires a clear trading plan, such as the one outlined above. Making spontaneous trading decisions based solely on current market conditions is an inherently losing strategy for intraday traders.
The material has been provided by InstaForex Company - www.instaforex.com.GBP/USD: Tips for Beginner Traders – January 13th (US Session)
.Trade Review and Tips for Trading the British Pound
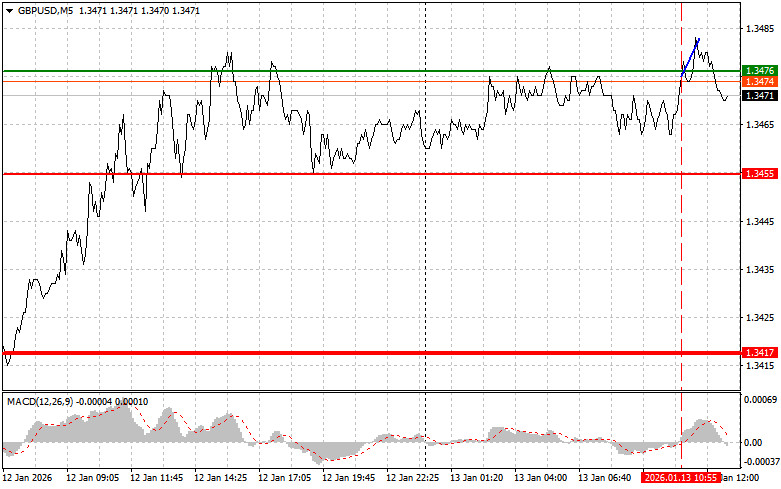
The test of the 1.3476 level occurred when the MACD indicator was just starting to move upwards from the zero line, which confirmed it as the correct entry point for buying the pound. As a result, the pair rose by only 7 points, and the bullish potential was exhausted.
The speech by Bank of England Governor Andrew Bailey did not significantly affect the British pound or support continued growth. Traders had expected clearer signals from the BoE chief regarding the future direction of monetary policy, but Bailey chose to maintain a neutral stance, offering no hints of either a rate hike or a rate cut. This cautious approach likely prompted market participants to adopt a wait-and-see attitude, which was reflected in the pound's price action.
Now, market participants are eagerly awaiting the release of US inflation data, as it may provide insight into the future path of Federal Reserve monetary policy. If the Consumer Price Index (CPI) comes in higher than expected, it could strengthen the case for more aggressive interest rate maintenance, which would support the US dollar.
US new home sales will also be closely monitored, as they are a key indicator of the housing market and overall economic activity. The data is expected to show how high interest rates and concerns over slowing economic growth are affecting demand for housing. Stronger-than-expected figures could signal resilience in the housing sector, while weaker data might increase fears of a broader economic slowdown. Additionally, a speech from FOMC member Alberto Musalem will draw attention, as investors will be looking for any clues on his views regarding the state of the economy and the likely trajectory of interest rates.
Regarding intraday strategy, I will focus more on implementing Scenario 1 and Scenario 2.
Buy Signal
Scenario No. 1:
I plan to buy the pound today if the price reaches the 1.3481 entry point (green line on the chart), targeting a move to the 1.3512 level (thicker green line on the chart). At 1.3512, I will exit the buy positions and consider opening sell positions in the opposite direction, targeting a 30–35 point move back from the entry level. You can expect the pound to rise today only after a drop in US inflation.
Important: Before buying, ensure that the MACD indicator is above the zero line and just beginning to rise from it.
Scenario No. 2:
I also plan to buy the pound today if there are two consecutive tests of the 1.3464 level while the MACD is in the oversold zone. This would limit the downward potential of the pair and trigger a market reversal to the upside. Expect a move toward the opposite levels of 1.3481 and 1.3512.
Sell Signal
Scenario No. 1:
I plan to sell the pound today after the price updates to the 1.3464 level (red line on the chart), which could lead to a sharp decline in the pair. The key target for sellers will be the 1.3434 level, where I will exit the sell positions and immediately open buy positions in the opposite direction, aiming for a 20–25 point move back. Pressure on the pound could return today if US inflation rises.
Important: Before selling, ensure that the MACD indicator is below the zero line and just beginning to decline from it.
Scenario No. 2:
I also plan to sell the pound today if there are two consecutive tests of the 1.3481 level while the MACD is in the overbought zone. This would limit the pair's upward potential and trigger a reversal to the downside. A move toward the opposite levels of 1.3464 and 1.3434 can be expected.
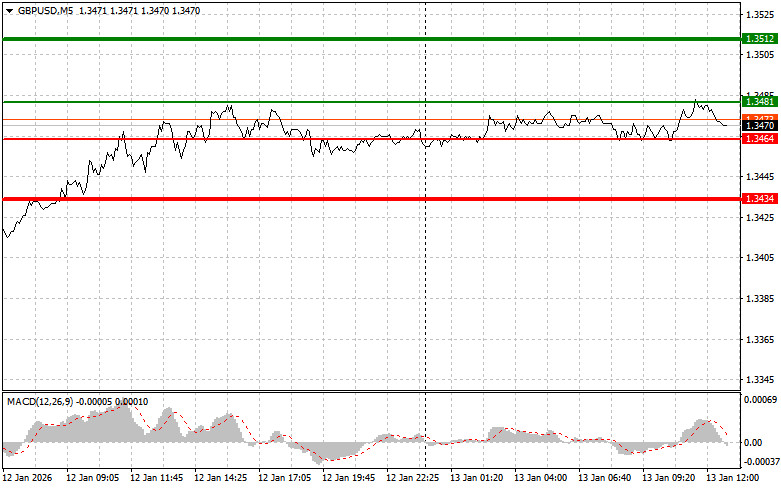
Chart Explanation:
- Thin Green Line — Entry price for buying the instrument
- Thicker Green Line — The projected price level where you can place a Take Profit order or manually lock in profits, as further upside above this level is unlikely
- Thin Red Line — Entry price for selling the instrument
- Thicker Red Line — The projected price level where you can place a Take Profit order or manually lock in profits, as further downside below this level is unlikely
- MACD Indicator — When entering trades, it is important to pay attention to overbought and oversold zones
Important Notice for Beginner Traders
Beginner Forex traders must be very cautious when making market entry decisions. Before the release of major fundamental reports, it is best to stay out of the market to avoid sudden price swings. If you choose to trade during news releases, always use stop-loss orders to minimize potential losses. Without stop-loss protection, you can quickly lose your entire deposit, especially if you do not practice money management and trade with large position sizes.
Finally, remember that successful trading requires a clear trading plan, like the one I've outlined above. Making spontaneous trading decisions based solely on the current market situation is an inherently losing strategy for intraday traders.
The material has been provided by InstaForex Company - www.instaforex.com.EUR/USD: Tips for Beginner Traders — January 13th (US Session)
.Trade Review and Trading Advice for the Euro
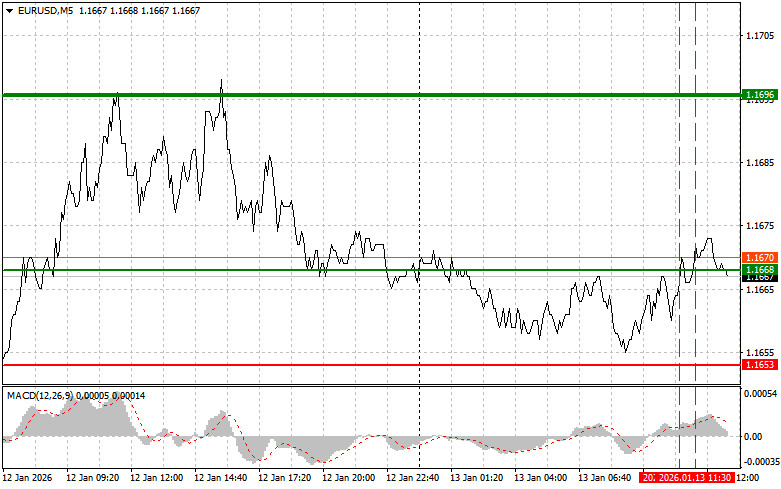
The test of the 1.1668 level occurred when the MACD indicator had already moved significantly above the zero line, which limited the pair's further upward potential. For this reason, I did not buy the euro. A second test of 1.1668, when the MACD was already in overbought territory, allowed Sell Scenario No. 2 to play out. However, as you can see on the chart, the pair ultimately failed to post a significant decline.
The lack of statistical data from the eurozone had a noticeable impact on EUR/USD price fluctuations and prevented the euro-selling scenario from fully materializing. In the absence of key economic indicators, market participants shifted their focus to news from the United States. Later today, US Consumer Price Index (CPI) data for December will be released, including core CPI, which excludes food and energy prices. These indicators are closely monitored by the market, as they provide important signals about inflation levels. A rise in CPI could prompt the Federal Reserve to maintain a more restrictive stance, while softer readings could ease pressure and give the regulator more room for further rate cuts.
In addition, a speech by FOMC member Alberto Musalem is scheduled. The market will carefully analyze his comments regarding the current economic situation, inflation outlook, and the Fed's next steps. Any hints of a policy shift could trigger volatility in the financial markets.
As for intraday trading, I will primarily rely on the implementation of Scenarios No. 1 and No. 2.
Buy Signal
Scenario No. 1
Today, buying the euro is possible near the 1.1675 level (green line on the chart), targeting a move toward 1.1696. At 1.1696, I plan to exit the market and also consider opening short positions in the opposite direction, aiming for a 30–35 point move from the entry point. A strong upward movement in the euro is more likely if US inflation declines.
Important: Before buying, make sure the MACD indicator is above the zero line and just beginning to rise from it.
Scenario No. 2
I also plan to buy the euro today if there are two consecutive tests of the 1.1659 level while the MACD is in oversold territory. This would limit the pair's downward potential and trigger a reversal to the upside. In this case, growth toward the opposite levels of 1.1675 and 1.1696 can be expected.
Sell Signal
Scenario No. 1
I plan to sell the euro after the price reaches the 1.1659 level (red line on the chart). The target will be 1.1633, where I intend to exit the market and immediately open long positions in the opposite direction, aiming for a 20–25 point rebound from that level. Selling pressure is likely to return if inflation increases.
Important: Before selling, make sure the MACD indicator is below the zero line and just beginning to decline from it.
Scenario No. 2
I also plan to sell the euro today if there are two consecutive tests of the 1.1675 level while the MACD is in overbought territory. This would cap the pair's upward potential and trigger a reversal to the downside. A decline toward the opposite levels of 1.1659 and 1.1633 can be expected.
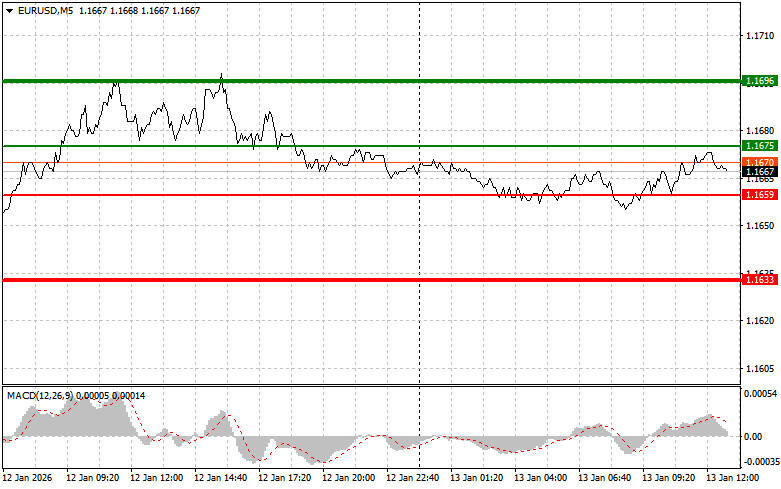
Chart Explanation
- Thin green line — entry price for buying the instrument
- Thick green line — projected take-profit level, where profits may be locked in, as further upside is unlikely above this level
- Thin red line — entry price for selling the instrument
- Thick red line — projected take-profit level, where profits may be locked in, as further downside is unlikely below this level
- MACD indicator — when entering trades, it is important to consider overbought and oversold zones
Important Notice for Beginner Traders
Beginner forex traders should be extremely cautious when making market-entry decisions. Ahead of major fundamental releases, it is best to stay out of the market to avoid sharp price swings. If you decide to trade during news releases, always use stop-loss orders to minimize losses. Without stop-loss protection, you can lose your entire deposit very quickly—especially if you do not apply proper money management and trade large position sizes.
Finally, remember that successful trading requires a clear trading plan, such as the one outlined above. Making spontaneous trading decisions based solely on current market conditions is an inherently losing strategy for an intraday trader.
The material has been provided by InstaForex Company - www.instaforex.com.The Pound Completes a Correction and Attempts to Resume Growth
.The most important reports that could have a direct impact on the pound's performance will be released on Thursday, January 15. These include GDP data for November, the NIESR estimate of economic growth for December, as well as November figures for industrial production and the trade balance.
No major surprises are expected. PMI indices continued to rise for the seventh consecutive month in November. Although growth momentum slowed slightly in December, the indices remained in positive territory. On the positive side, new orders in the services sector resumed growth, lending resilience to the economy. At the same time, employment has been declining for the fifteenth consecutive month, which does not fully align with the overall increase in sector activity. Another notable trend is rising pressure on average wages, which should help reduce persistently high inflation over time. Conversely, a sharp increase in costs in December is supporting inflationary pressures.
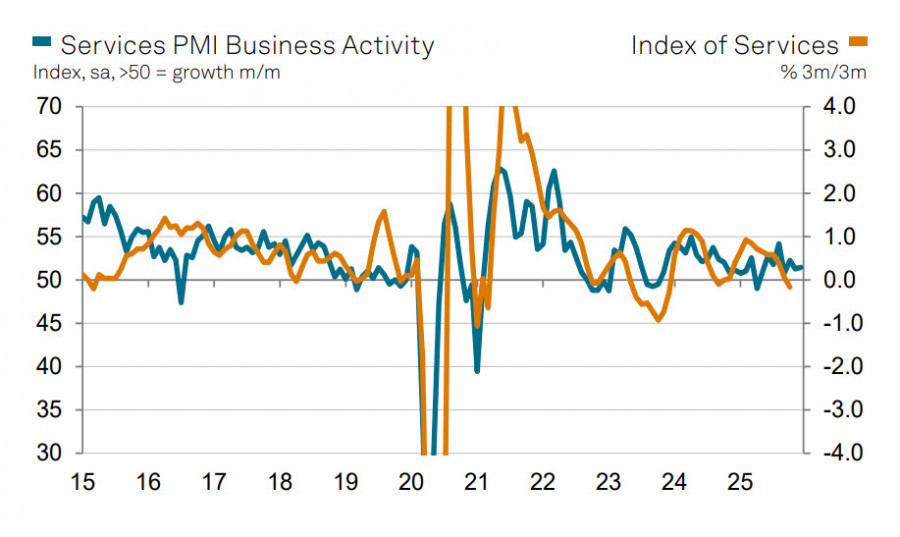
These inconsistencies do not yet provide a clear picture of the UK economy's underlying condition. If inflation continues to ease and the Bank of England gradually cuts interest rates, government bond yields could decline over the course of the year. This scenario currently appears to be the base case, which, at first glance, would limit the pound's ability to develop a long-term, sustainable bullish trend.
However, there is another risk of an external nature. In early February, Trump is expected to announce the name of Powell's successor as Fed Chair, and this is likely to be a candidate advocating monetary easing—at a minimum, faster rate cuts. Such a scenario is quite plausible and could lead to higher US Treasury yields, at least due to an increased risk premium. Liquidity would decline and volatility would rise. This trend would likely spill over into other markets, including the UK, and the pound would probably struggle to avoid weakening—especially if the Bank of England begins to consider restarting asset purchases to support liquidity.
It is clear that this scenario remains hypothetical at this stage, but it is difficult to predict how the investigation against Powell will ultimately unfold. US Treasury Secretary Scott Bessent has warned Trump that the investigation could have negative consequences for investor confidence and the economy as a whole. For now, we assume that pressure on the Federal Reserve is weakening the dollar and supporting the pound in the short term. However, further shocks with unpredictable consequences are almost certainly ahead. The aggressive policies of the US president could ultimately backfire, potentially accelerating de-dollarization and posing risks to the entire existing global currency system.
Net short positioning in the pound declined slightly over the reporting week to –$2.6 billion. Despite the UK having secured significantly more favorable trade terms with the US than the euro area, speculative investors continue to hold short positions in the pound, unlike in the euro. The calculated price has lost upside momentum but remains above its long-term average.
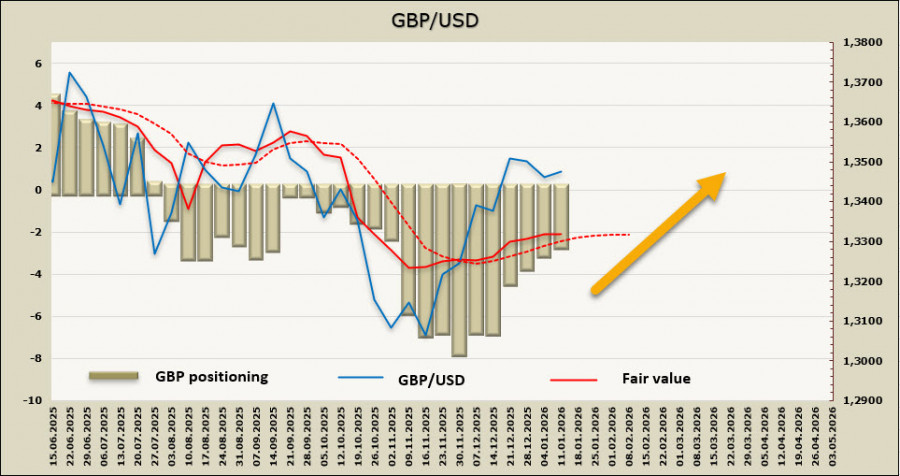
A week earlier, we expected the pound to build on its gains and test resistance at 1.3620–1.3640. This has not yet occurred, as the corrective pullback has been somewhat prolonged. Nevertheless, the 1.3620–1.3640 target remains valid. The probability of renewed growth remains higher than that of the correction developing into a full-fledged bearish trend. Dollar strength this week has been driven more by political factors than economic ones, and the pound still has a solid chance to resume its upward move.
The material has been provided by InstaForex Company - www.instaforex.com.GBP/USD. Analysis and Forecast
.
On Tuesday, GBP/USD extends the corrective recovery that began from the 1.3390 level, where the 200-day simple moving average (SMA) is located. The primary source of support for the pound is weakening interest in the US dollar, which has come under pressure due to growing doubts about the Federal Reserve's independence. Pressure on the US currency intensified following reports of a criminal investigation being launched against Fed Chair Jerome Powell. In a rare public statement, Powell stressed that threats of criminal prosecution are linked to the Fed's interest-rate decisions being guided by public interest rather than the president's political preferences.
Despite these negative developments, the US dollar has managed to halt its decline as expectations for more aggressive monetary easing by the Federal Reserve have diminished. This, in turn, is limiting further upside in GBP/USD.
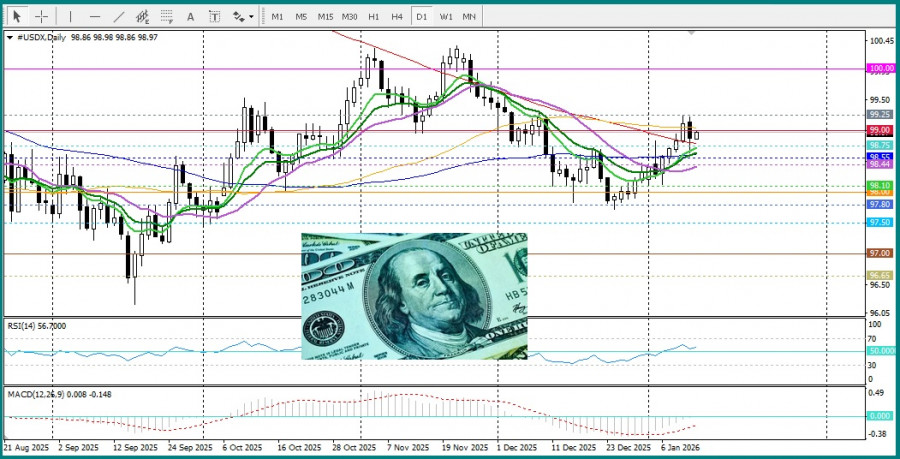
A decline in the US unemployment rate overshadowed weaker-than-expected Nonfarm Payrolls (NFP) data, reinforcing expectations that monetary policy will remain on hold in the first quarter. This is preventing dollar bears from engaging in aggressive selling, as investor attention is now focused on today's upcoming US inflation (CPI) data.
Additional pressure on the pound comes from rising expectations of two more interest rate cuts by the Bank of England in 2026, which could cap the pair's upward potential. In the coming days, GBP/USD dynamics will also depend on the release of the US Producer Price Index (PPI) on Wednesday and the UK GDP report on Thursday, both of which could set the pair's short-term direction.
From a technical perspective, daily-chart oscillators remain in positive territory, confirming a constructive outlook. The pair is supported by a confluence of three moving averages and is currently trading near resistance at 1.3470, above which the next resistance is seen at the psychological 1.3500 level.
However, a drop below the 200-day SMA would signal a loss of bullish control.
The material has been provided by InstaForex Company - www.instaforex.com.EUR/USD Forecast on January 13, 2026
.On Monday, the EUR/USD pair reversed in favor of the European currency and returned to the 38.2% Fibonacci retracement level at 1.1686. A rebound from this level worked in favor of the US dollar, leading to a modest decline toward the support zone at 1.1645–1.1648. A rebound from this area today would bring bulls back into the market, opening the way for an advance toward the 23.6% Fibonacci level at 1.1731. A close below this zone would increase the likelihood of a continued decline toward the support level at 1.1607–1.1612.
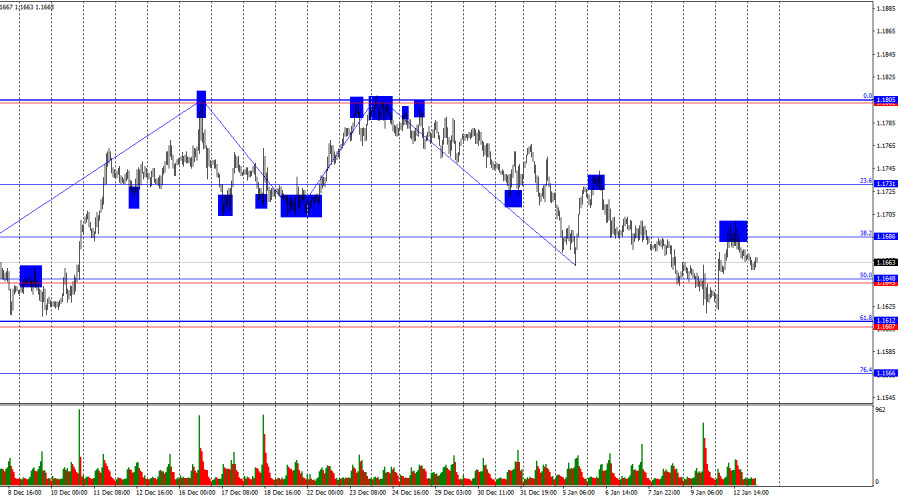
The wave structure on the hourly chart remains straightforward. The most recent completed upward wave failed to break above the previous peak, while the latest downward wave broke the prior low. As a result, the trend remains bearish. In my view, the decline is unlikely to be prolonged or deep, but a breakdown of the current bearish trend is now required before a bullish move can be expected. Based on the current chart structure, such a reversal would occur above the resistance level at 1.1795–1.1802 or after two consecutive bullish waves.
On Friday, bullish traders were presented with another strong opportunity to launch an attack, and this time they took advantage of it. Overnight, it emerged that criminal proceedings had been initiated against FOMC Chair Jerome Powell in connection with the renovation of the Federal Reserve headquarters. In an official statement, Powell said the charges were brought in an attempt to force the regulator to cut interest rates. The White House stated that Powell had misled the US Congress during discussions of the renovation budget, which, in its view, warrants a judicial investigation and verdict.
In my opinion, Powell's version of events raises little doubt. At the very least, the market's reaction yesterday—selling the US dollar—made it clear that traders do not trust Trump. The dollar's decline was not sharp, but it could intensify as the situation surrounding Powell develops. Investors are unlikely to place confidence in the currency of a country where the president, lacking the authority to do so, openly interferes with the work of the central bank and allegedly manufactures criminal cases to remove undesirable officials.
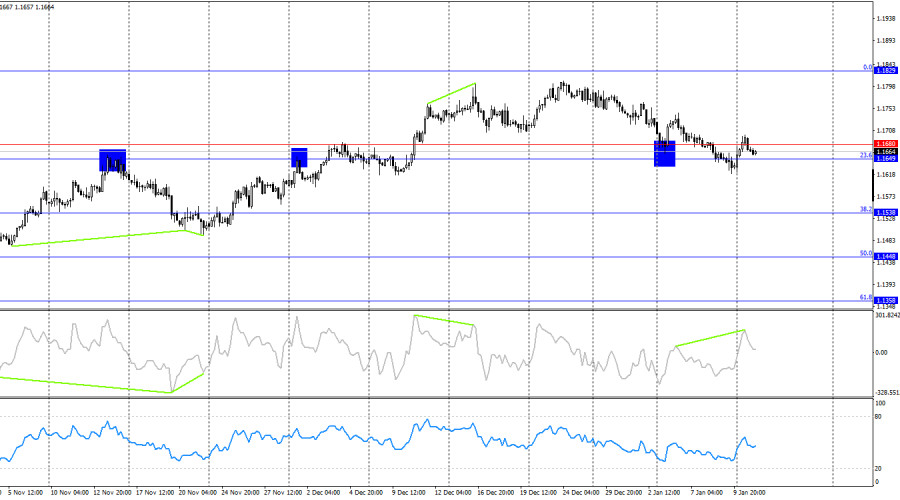
On the 4-hour chart, the pair has returned to the support level at 1.1649–1.1680. Another rebound from this area would favor the euro and a moderate rise toward the 0.0% retracement level at 1.1829. A sustained move below the 1.1649–1.1680 support level would increase the chances of continued decline toward the next 38.2% Fibonacci level at 1.1538. A bearish divergence has formed on the CCI indicator, suggesting the potential for another downward move.
Commitments of Traders (COT) Report
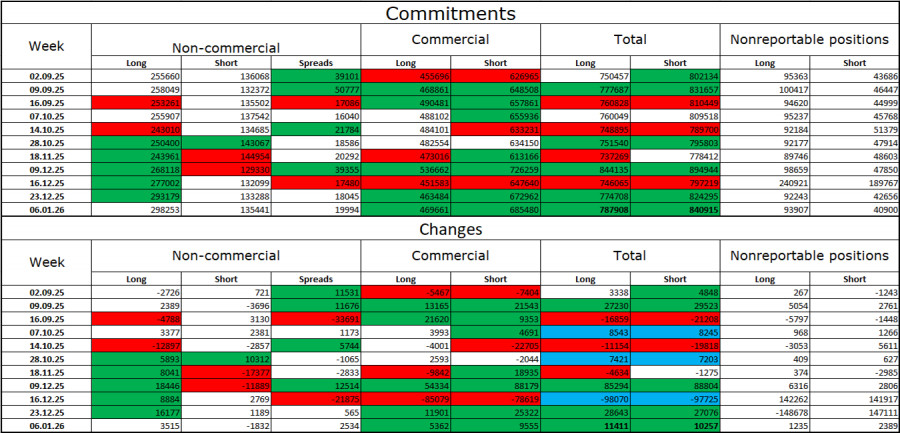
During the latest reporting week, professional market participants opened 3,515 long positions and closed 1,832 short positions. Sentiment among non-commercial traders remains bullish, largely due to Donald Trump and his policies, and continues to strengthen over time. The total number of long positions held by speculators now stands at 298,000, while short positions amount to 135,000—giving bulls a more than twofold advantage.
For thirty-three consecutive weeks, large players were reducing short positions and increasing long positions. This was followed by the government shutdown, and now we are seeing the same pattern again: professional traders continue to build long positions. Donald Trump's policies remain the most significant factor for traders, as they generate numerous problems that are likely to have long-term and structural consequences for the US economy—such as deterioration in the labor market. Traders fear a loss of Federal Reserve independence in 2026 under pressure from Trump, especially amid the potential resignation of Jerome Powell.
Economic Calendar: United States and Eurozone
- US — Consumer Price Index (13:30 UTC)
- US — New Home Sales (13:30 UTC)
On January 13, the economic calendar contains two noteworthy releases. The impact of the news flow on market sentiment is expected in the second half of the day.
EUR/USD Forecast and Trading Recommendations
Selling opportunities emerged after the rebound from the 1.1686 level on the hourly chart, with targets at 1.1648 and 1.1612. These positions may be kept open today. Buying opportunities appeared after a consolidation above the 1.1645–1.1648 level on the hourly chart, with targets at 1.1686 and 1.1731; the first target has already been reached. New long positions may be considered on a rebound from the 1.1645–1.1648 level.
Fibonacci grids are drawn from 1.1492 to 1.1805 on the hourly chart and from 1.1066 to 1.1829 on the 4-hour chart.
The material has been provided by InstaForex Company - www.instaforex.com.GBP/USD Forecast on January 13, 2026
.On the hourly chart, GBP/USD reversed in favor of the British pound on Monday and returned to the 1.3437–1.3470 level, around which trading has been concentrated over the past three weeks. A sustained move above this area would allow traders to expect further growth toward the resistance zone at 1.3526–1.3539. A consolidation below the zone, by contrast, would point to a decline toward 1.3352–1.3362.
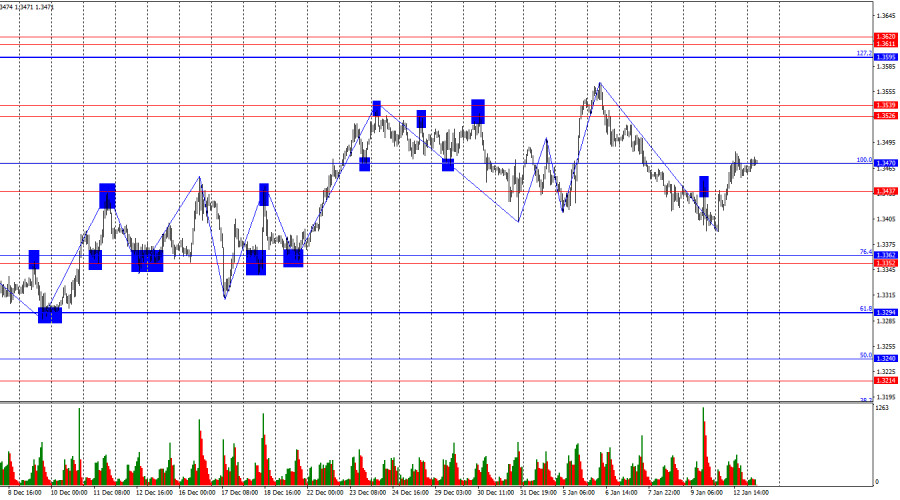
The wave structure remains bullish. The most recently completed upward wave exceeded the previous high, while the new downward wave broke the prior low by only a few pips—insufficient to invalidate the prevailing trend. The fundamental backdrop for the pound has been weak in recent weeks, but the US news flow has also been far from supportive. Bears have been on the offensive in recent days, but a breakdown of the bullish trend would only occur below the 1.3403 level.
Monday's news flow supported the bulls, who had been largely inactive throughout the previous week. It is worth recalling that several important reports were released in the US last week, and only the ISM Services PMI favored the bears. In all other cases, bulls had ample opportunity to go on the offensive but failed to do so. However, at the start of the new week, the Donald Trump administration leveled accusations against FOMC Chair Jerome Powell, triggering a sharp retreat by bears from the market. In my view, renewed pressure from Trump on the Federal Reserve this year is unlikely to have a positive impact on the US dollar. Its decline could continue on Tuesday.
Today, the US will publish inflation data, which could also force bears to continue retreating. In November, the Consumer Price Index slowed to 2.7%, but I believe this was a temporary phenomenon caused by seasonal promotional activity. Most likely, December figures will show renewed growth in consumer prices. This would be relatively supportive for the dollar, as elevated inflation would prevent the Fed from continuing monetary easing. However, entirely different issues are currently dominating the agenda.
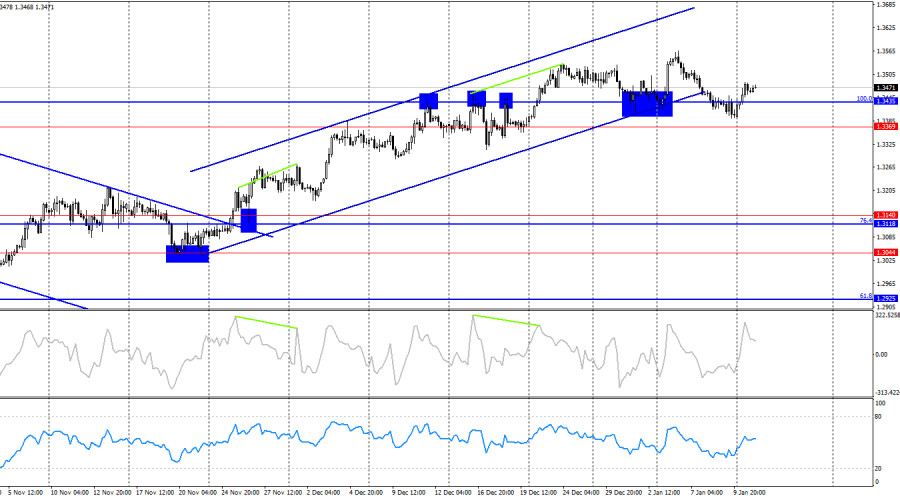
On the 4-hour chart, the pair has returned to the support level at 1.3369–1.3435. A rebound from this area would once again favor the pound and a resumption of growth toward the next Fibonacci level at 127.2% (1.3795). A sustained move below the 1.3369–1.3435 level would allow traders to expect a reversal in favor of the US dollar and a decline toward the support level at 1.3118–1.3140. No emerging divergences are observed at this time.
Commitments of Traders (COT) Report
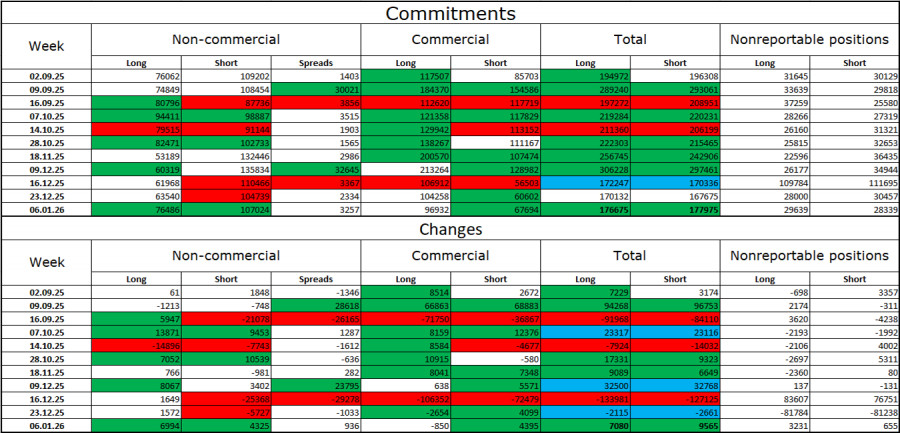
Sentiment among non-commercial traders became more bullish over the latest reporting week. The number of long positions held by speculators increased by 6,994, while short positions rose by 4,325. The gap between long and short positions now stands at approximately 76,000 versus 107,000 and is narrowing rapidly. Bears have dominated in recent months, but the pound appears to have largely exhausted its downward potential. At the same time, the situation in euro contracts is the exact opposite. I still do not believe in a sustained bearish trend for the pound.
In my view, the pound remains less "risky" than the US dollar. In the short term, the US currency may occasionally benefit from demand, but not over the long term. Donald Trump's policies have led to a sharp deterioration in the labor market, forcing the Federal Reserve to ease monetary policy in order to curb rising unemployment and stimulate job creation. US military aggression also does little to boost optimism among dollar bulls.
Economic Calendar: US and UK
- US — Consumer Price Index (13:30 UTC)
- US — New Home Sales (13:30 UTC)
On January 13, the economic calendar contains two releases, one of which is considered significant. The impact of the news flow on market sentiment is expected in the second half of the day.
GBP/USD Forecast and Trading Recommendations
Selling the pair may be considered today on a rebound from the 1.3437–1.3470 level on the hourly chart, with targets at 1.3352–1.3362. Buying opportunities may be considered if prices consolidate above the 1.3437–1.3470 level on the hourly chart, targeting 1.3526–1.3539.
Fibonacci grids are drawn from 1.3470 to 1.3010 on the hourly chart and from 1.3431 to 1.2104 on the 4-hour chart.
The material has been provided by InstaForex Company - www.instaforex.com.The Decline of the Japanese Yen Is Gaining Momentum
.The decline of the Japanese yen is gaining momentum amid growing expectations of a further divergence in monetary policy between Japan and the United States. While the US Federal Reserve continues to face difficult policy choices and remains inclined toward a restrictive stance, the Bank of Japan is struggling with the timing and feasibility of future interest rate hikes. This imbalance is putting sustained pressure on the yen.

Speculation about snap elections that could be called by Prime Minister Sanae Takaichi is also weighing on the Japanese currency. Many traders are concerned that a change in government could lead to a shift in economic policy and undermine the yen's attractiveness. It is worth recalling that after Takaichi assumed office last year, the yen reacted with a sharp decline, as the new prime minister immediately announced a course of economic stimulus and support. This approach runs counter to the central bank's plans to raise interest rates.
Following yesterday's aggressive sell-off in the yen, Japanese officials stepped up verbal interventions, warning against excessive currency speculation. However, it remains unclear whether concrete measures will be taken to support the yen. Direct intervention in the foreign exchange market is a costly and often ineffective tool, and the government is likely to refrain from using it unless the situation becomes critical.
It is forecast that the yen could continue to weaken, potentially reaching the 160 level against the US dollar, unless there are significant changes in monetary policy or decisive government action to support the currency. Further depreciation of the yen could lead to higher import costs and increased inflationary pressure in Japan, creating additional challenges for the economy.
In the near term, traders will be closely monitoring yen dynamics, watching for signals of policy shifts from the Bank of Japan, government decisions regarding potential elections, and any signs of official intervention in the foreign exchange market. All of these factors will play a key role in determining the future direction of the Japanese currency.
As for the current technical outlook for USD/JPY, buyers need to break through the nearest resistance at 159.10. This would open the way toward 159.45, a level that is expected to be difficult to overcome. The most distant upward target stands at 159.75. In the event of a decline, bears will attempt to regain control at 158.75. A successful break below this level would deal a serious blow to bullish positions and could push USD/JPY down toward the 158.46 low, with the potential for a further move to 158.22.
The material has been provided by InstaForex Company - www.instaforex.com.Forex forecast 13/01/2026: EUR/USD, USD/JPY, GBP/USD, SP500, Oil, Gold and Bitcoin
.We introduce you to the daily updated section of Forex analytics where you will find reviews from forex experts, up-to-date monitoring of financial information as well as online forecasts of exchange rates of the US dollar, euro, ruble, bitcoin, and other currencies for today, tomorrow and this trading week.
Useful links:
My other articles are available in this section
InstaForex course for beginners
Important:
The begginers in forex trading need to be very careful when making decisions about entering the market. Before the release of important reports, it is best to stay out of the market to avoid being caught in sharp market fluctuations due to increased volatility. If you decide to trade during the news release, then always place stop orders to minimize losses.
Without placing stop orders, you can very quickly lose your entire deposit, especially if you do not use money management and trade large volumes. For successful trading, you need to have a clear trading plan and stay focues and disciplined. Spontaneous trading decision based on the current market situation is an inherently losing strategy for a scalper or daytrader.
#instaforex #analysis #sebastianseliga
The material has been provided by InstaForex Company - www.instaforex.com.Stock market on January 13: S&P 500 and NASDAQ edge higher
.Yesterday, stock indices closed higher. The S&P 500 rose by 0.16%, while the Nasdaq 100 gained 0.26%. The Dow Jones Industrial Average jumped by 0.17%.
The US equity rally spilled over into Asia, where lower valuations and stronger growth prospects attracted investors who broadened their focus beyond US markets. The MSCI All Country World Index, one of the broadest market gauges, rose by 0.1% as Asian equities hit record highs. Futures on stock indices point to the rally continuing in Europe, while US index futures indicate a softer start after the S&P 500 closed Monday at a record high.

Against the backdrop of positive equity market dynamics, Treasuries eased slightly, with the yield on the benchmark 10?year note rising just over one basis point to 4.19%. Gold and silver partially recouped earlier losses. Brent crude reached its highest level since November after comments by President Donald Trump about imposing tariffs on goods from countries doing business with Iran.
Most of the action took place in Japan, where stocks jumped and government bond yields surged amid speculation that Prime Minister Sanae Takaichi might call an early election. The yen fell to its weakest level versus the dollar since July 2024.
Further equity gains may run into key risks related to US inflation data and a potential Supreme Court ruling on Trump's tariffs. Core CPI in the US, which excludes volatile food and energy prices, is expected to rise 2.7% year?on?year in December.
Market dynamics also indicate that investors are looking beyond the US, where renewed attacks by the Trump administration on the Federal Reserve have stoked concerns over the central bank's independence. RBC Capital Markets LLC said that investors had become more open to geographically diversifying their equity holdings and that, with the start of the new year, they had new reasons to do so.
Meanwhile, the fourth?quarter 2025 earnings season kicks off later this week and is expected to show solid results.
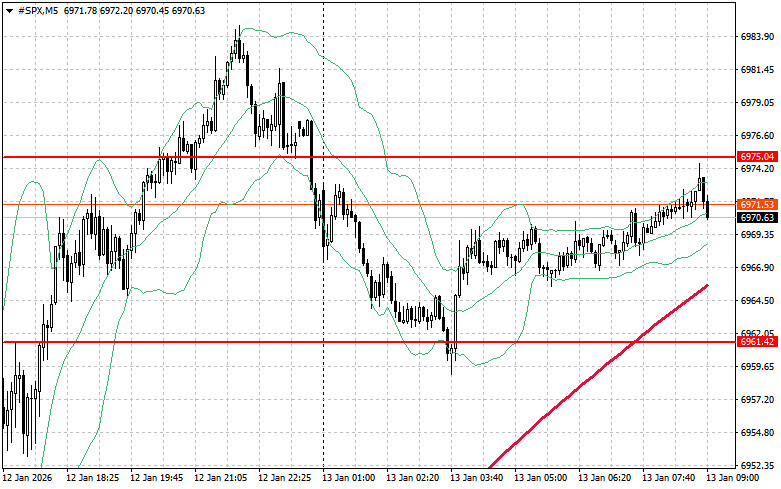
As for the technical outlook for the S&P 500, the immediate task for buyers today is to overcome the nearest resistance level of $6,975. Overcoming this level would signal upside and open the path to $6,993. An equally important objective for bulls is to secure control above the $7,013 mark, which would strengthen buyers' positions. In case of a downside move amid waning risk appetite, buyers must assert themselves around $6,961. A break below this level could quickly push the instrument back to $6,946 and open the way to $6,930.
The material has been provided by InstaForex Company - www.instaforex.com.GBP/USD: plan for the European session on January 13. Commitment of Traders reports. The pound retains chances for growth
.Yesterday, several entry points into the market were formed. Let's look at the 5-minute chart and analyze what happened. In my morning forecast, I highlighted the 1.3460 level and planned to make entry decisions based on it. The rise and formation of a false breakout around 1.3460 provided a sell entry point for the pound, resulting in a drop of about 15 pips. In the second half of the day, active seller actions around 1.3484 allowed entry into short positions, which led to a 30-pip decline.
For opening long positions on GBPUSD, it is required:
Before dissecting the technical picture of the pound, let's look at what happened in the futures market. In the COT report (Commitment of Traders) for January 6, there was growth in both long and short positions. The probability of rate cuts in the US weakened considerably after the latest US labor market data, but a new risk for the dollar emerged: sharp pressure from the Trump administration on the Fed, which suggests persistent problems for the dollar and short-term growth for the British pound. At the same time, Bank of England policy remains restrained, indicating their clear plans to continue fighting inflation, although this has not given much confidence to pound buyers recently. The latest COT report indicates that non-commercial long positions increased by 6,994 to 76,486, while non-commercial short positions rose by 4,325 to 107,024. As a result, the spread between longs and shorts widened by 936.
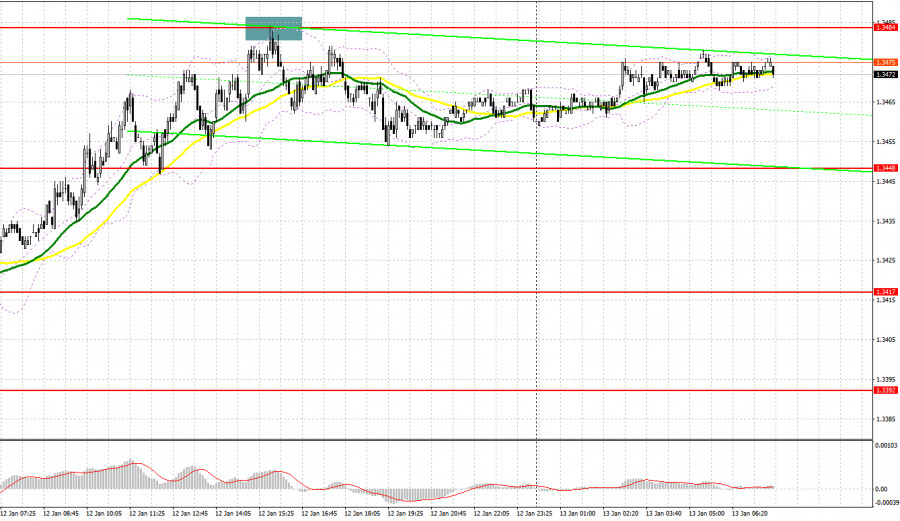
Today, in the first half of the day, a speech by Bank of England Governor Andrew Bailey is expected. His remarks may concern future Bank of England policy, so a spike in GBP/USD volatility is guaranteed. In the case of a dovish stance, the pair may correct, which I plan to use. The formation of a false breakout around the new support at 1.3448 will be a reason to open a long position targeting a return of GBP/USD to resistance at 1.3484, which failed to be overcome yesterday. A breakout and retest of this range will give a chance for further GBP/USD recovery, leading to new long positions and allowing the pair to reach 1.3514. If price moves above that range, a push to 1.3539 can be expected, where I plan to take profit. If GBP/USD falls and there are no buyers around 1.3448, bears will try to force a larger sell-off, which could lead to a decline toward the next support at 1.3417. The formation of a false breakout there would be a suitable entry condition. Opening long positions immediately on a rebound can be done from 1.3392 with a target of a 30–35 pip intraday correction.
For opening short positions on EURUSD, it is required:
Pressure on the pound did not return yesterday. If the uptrend continues after Bailey's speech, I will only consider shorts in the case of a false breakout at resistance 1.3484. Only that will provide a good short entry targeting a drop to support at 1.3448, where moving averages pass and favor buyers. A breakout and retest of this range from below will increase pressure on the pair, giving bears the advantage and another short entry to target a move toward 1.3417. There, I expect a stronger buyer reaction. The farthest target for bears will be the 1.3392 low, where I will take profit. If GBP/USD rises and bears are absent at 1.3484, the bearish market will be over, and buyers will get a chance for a larger recovery to resistance 1.3514 — I will only sell there on a false breakout. If there is no activity there, I recommend opening short positions from 1.3539, expecting a 30–35 pip intraday rebound downward.
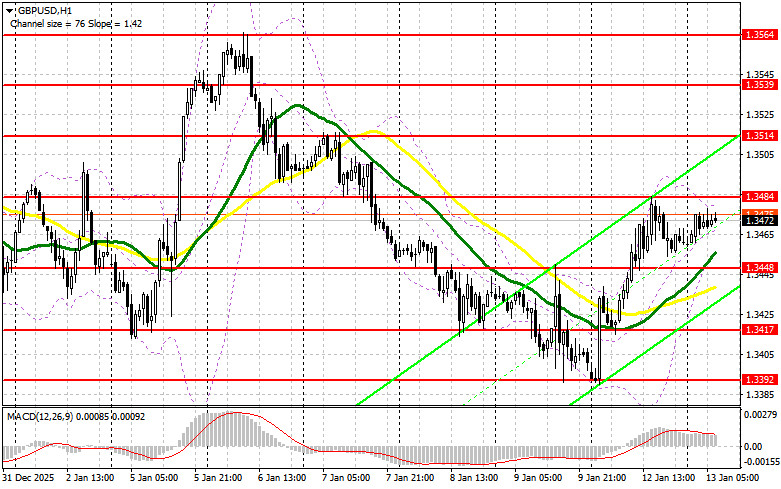
Indicator signals
Moving averages
Trading is taking place above the 30- and 50- day moving averages, indicating possible pound growth.
Note: the period and price basis of the moving averages are considered by the author on the hourly H1 chart and differ from the classical daily moving averages on the D1 chart.
Bollinger Bands
In case of a rise, the upper band will act as resistance around 1.3480. In the event of a decline, the lower band will provide support at around 1.3448.
Indicator descriptions
- Moving average — smooths volatility and noise to determine the current trend. Period — 50. Marked in yellow on the chart.
- Moving average — smooths volatility and noise to determine the current trend. Period — 30. Marked in green on the chart.
- MACD (Moving Average Convergence/Divergence) — fast EMA period 12, slow EMA period 26, signal SMA period 9.
- Bollinger Bands — period 20.
- Non-commercial traders — speculators such as retail traders, hedge funds, and large institutions using the futures market for speculative purposes and meeting certain criteria.
- Non-commercial long positions — the total long open position of non-commercial traders.
- Non-commercial short positions — the total short open position of non-commercial traders.
- Net non-commercial position — the difference between non-commercial long and short positions.
EUR/USD: plan for the European session on January 13. Commitment of Traders reports. The dollar's decline stalled
.Yesterday, several entry points into the market were formed. Let's look at the 5-minute chart and figure out what happened there. In my morning forecast, I highlighted the 1.1681 level and planned to make entry decisions based on it. The rise and formation of a false breakout around 1.1681 provided a sell entry for the euro, but it did not lead to a major decline in the pair. In the second half of the day, sellers' active actions, already around 1.1694, led to another euro sale, driving the pair down 30 pips.
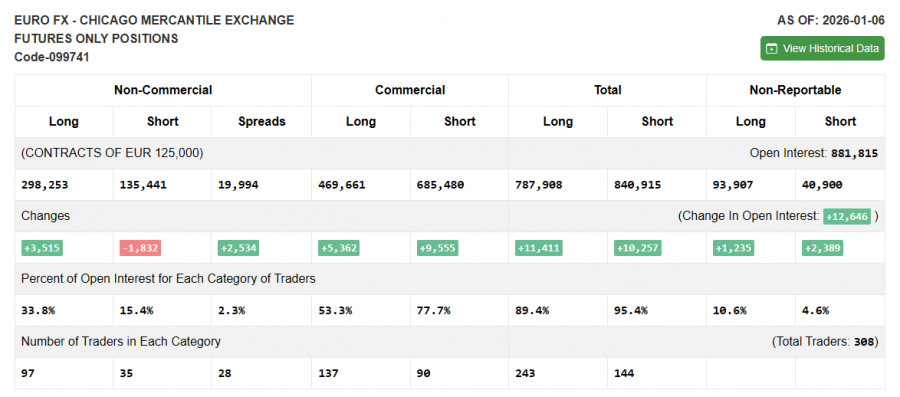
For opening long positions on EURUSD, it is required:
Before talking about further prospects for EUR/USD movement, let's look at what happened on the futures market and how Commitment of Traders positions changed. In the COT report (Commitment of Traders) for January 6, there was an increase in long positions and a reduction in shorts. Expectations of a pause in the Federal Reserve's rate-cutting cycle do not help the US dollar to strengthen. The main reason is the difficulties the Federal Reserve has begun encountering again, and the pressure exerted on it by the Trump administration. Until this issue is fully resolved, traders will prefer risk assets. The COT report indicates that non-commercial long positions increased by 3,515 to 298,253, while non-commercial short positions decreased by 1,832 to 135,441. As a result, the spread between long and short positions increased by 2,534.
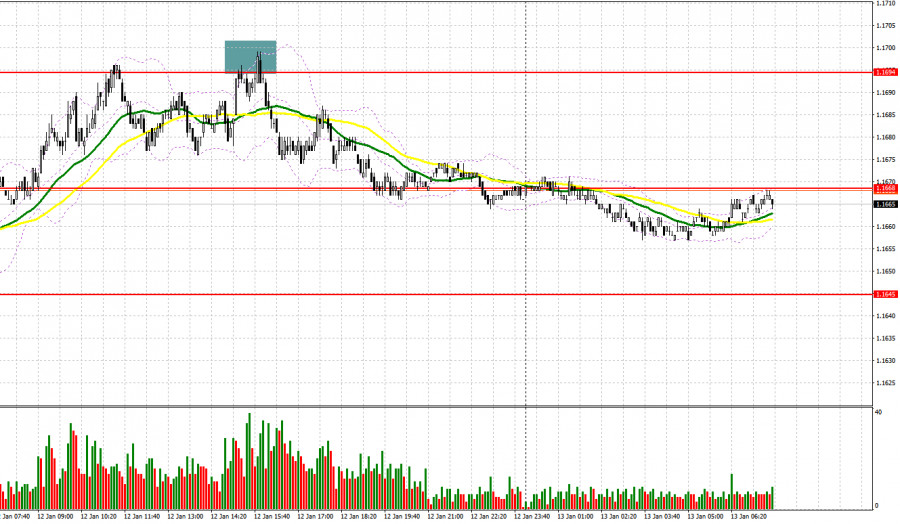
Today, in the first half of the day, there is no eurozone data. No public statements by European politicians are scheduled either, so the market may remain on the side of dollar buyers. With a small return of pressure on the euro, I expect the first buyer reaction around 1.1646. Only the formation of a false breakout will provide an entry point into the market, with a target to rise to the resistance at 1.1672, formed yesterday. A breakout and a retest of this range would confirm the correct action to buy the euro, aiming for a larger rise in the pair to 1.1697, which would indicate buyers regaining initiative. The farthest target will be the 1.1717 area, where I will take profits. If EUR/USD falls and there is no activity around 1.1646, pressure on the pair may return. Sellers will likely be able to reach the more interesting level 1.1619. Only if the formation of a false breakout forms will there be a suitable condition to buy the euro. Opening long positions immediately on the rebound will be from 1.1591 with a target of a 30–35 pip intraday upward correction.
For opening short positions on EURUSD, it is required:
Sellers did everything they could yesterday to stop the euro's bull market, and it seems they succeeded. Today, the main task will be defending the resistance at 1.1672, where the moving averages cross. Only the formation of a false breakout will be a reason to sell, targeting a decline to support at 1.1646. A breakout and consolidation below this range, as well as a retest from below to above, will be another suitable option to open short positions with a move toward 1.1619, which would return a bearish character to the market. The farthest target will be the 1.1591 area, where I will take profits. If EUR/USD moves up in the first half of the day and there is no active bear action around 1.1672, short positions are best postponed until the next resistance at 1.1697. Sell there only after a failed consolidation. I plan to open short positions immediately on the rebound from 1.1717, targeting a 30–35 pip downward correction.
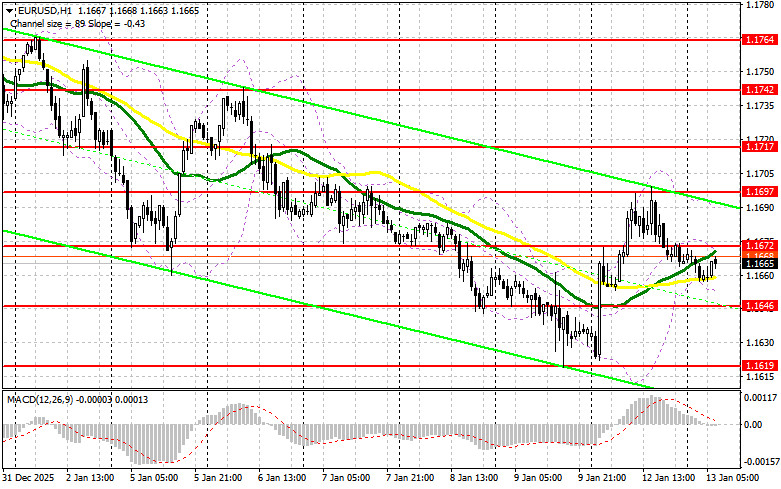
Indicator signals
Moving averages
Trading is conducted around the 30- and 50-day moving averages, indicating market uncertainty.
Note: the period and price basis of the moving averages are considered by the author on the hourly H1 chart and differ from the classical daily moving averages on the D1 chart.
Bollinger Bands
In the event of a decline, support will be provided by the indicator's lower band at around 1.1655. In case of a rise, the upper band will act as resistance around 1.1695.
Indicator descriptions
- Moving average — smooths volatility and noise to determine the current trend. Period — 50. Marked in yellow on the chart.
- Moving average — smooths volatility and noise to determine the current trend. Period — 30. Marked in green on the chart.
- MACD (Moving Average Convergence/Divergence) — fast EMA period 12, slow EMA period 26, signal SMA period 9.
- Bollinger Bands — period 20.
- Non-commercial traders — speculators such as retail traders, hedge funds, and large institutions using the futures market for speculative purposes and meeting certain criteria.
- Non-commercial long positions — the total long open position of non-commercial traders.
- Non-commercial short positions — the total short open position of non-commercial traders.
- Net non-commercial position — the difference between non-commercial long and short positions.
USDJPY: simple trading tips for beginner traders for January 13. Review of yesterday's Forex trades
.Trade review and trading tips for the Japanese yen
The price test at 157.76 coincided with the MACD indicator moving far below the zero line, which limited the pair's downside potential. The second test of 157.76 occurred when the MACD was in the oversold area, triggering buy scenario No. 2 and driving the pair up by more than 40 pips.
Today, the yen fell to its weakest level against the dollar since July 2024. Yesterday's acceleration of the decline occurred amid speculation that Prime Minister Sanae Takaichi may soon announce early elections. Given the prime minister's high popularity, holding elections will likely strengthen her authority and give a second impulse to Takaichi's policy, which contributed to the weakening of the national currency when she took office last year. It is expected that, in the absence of intervention by the Bank of Japan, the yen's weakening will continue toward 160 per dollar. This will be driven directly by the persistent, significant yield gap between the US and Japan, negative real interest rates, and ongoing capital outflows.
As for the intraday strategy, I will mostly rely on implementing scenarios No. 1 and No. 2.
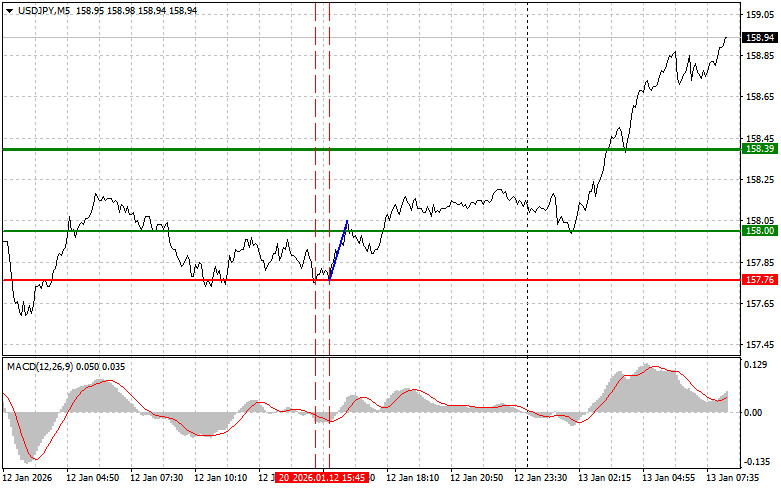
Buy scenarios
Scenario No. 1: I plan to buy USD/JPY today at an entry point around 159.14 (green line on the chart), targeting a rise to 159.80 (thicker green line on the chart). Around 159.80, I intend to exit longs and open shorts in the opposite direction (expecting a 30–35-pip countermove from that level). It is best to resume buying the pair on corrections and significant pullbacks in USD/JPY. Important! Before buying, make sure the MACD indicator is above the zero line and only beginning to rise from it.
Scenario No. 2: I also plan to buy USD/JPY today in case of two consecutive tests of 158.68 when the MACD indicator is in the oversold area. This will limit the pair's downside potential and lead to an upward reversal. One can expect a rise toward the opposing levels 159.14 and 159.80.
Sell scenarios
Scenario No. 1: I plan to sell USD/JPY today only after a break below 158.68 (red line on the chart), which will lead to a rapid decline in the pair. The key target for sellers will be 158.06, where I plan to exit shorts and immediately open longs in the opposite direction (expecting a 20–25-pip countermove from that level). It is better to sell at the highest possible price. Important! Before selling, make sure the MACD indicator is below the zero line and only beginning to decline from it.
Scenario No. 2: I also plan to sell USD/JPY today in case of two consecutive tests of 159.14 when the MACD indicator is in the overbought area. This will limit the pair's upside potential and lead to a reversal downward. One can expect a decline toward the opposing levels 158.68 and 158.06.
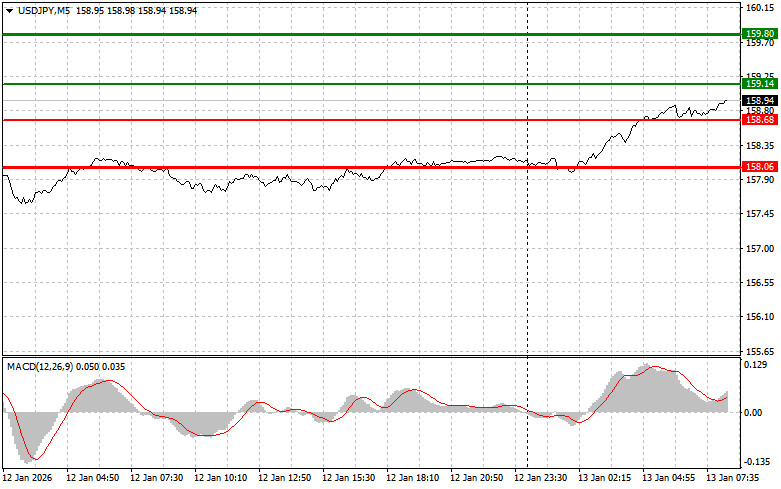
What is on the chart
- Thin green line — entry price at which you can buy the instrument
- Thick green line — suggested Take Profit price or level at which to manually lock in profit, since further rise above this level is unlikely.
- Thin red line — entry price at which you can sell the instrument
- Thick red line — suggested Take Profit price or level at which to manually lock in profit, since further decline below this level is unlikely.
- MACD indicator — when entering the market, it is important to follow the overbought and oversold zones
- Important notes: Beginner forex traders must be very cautious when deciding to enter the market. It is best to be out of the market before major fundamental reports are released to avoid being caught in sharp price swings. If you decide to trade during news releases, always place stop orders to minimize losses. Without stop orders, you can lose your entire deposit quickly, especially if you do not use money management and trade large volumes.
- Remember that successful trading requires a clear trading plan like the one presented above. Spontaneous trading decisions based on current market noise are a losing strategy for the intraday trader.
GBPUSD: simple trading tips for beginner traders for January 13. Review of yesterday's Forex trades
.Trade review and trading tips for the British pound
The price test at 1.3455 occurred when the MACD indicator had moved far below the zero line, limiting the pair's downside potential.
Yesterday's slowdown in the dollar's decline happened after a number of Republican senators expressed disagreement with Donald Trump's statements toward Fed Chair Jerome Powell, who was again accused, including with criminal prosecution. This unexpected turn, caused by political instability, supported the weakened dollar, allowing it to recover slightly after the preceding wave of sales.
This morning, Bank of England Governor Andrew Bailey is scheduled to give a public speech, which may affect the pair's direction. His comments are expected to touch on the future strategy of monetary policy, which will almost certainly provoke increased volatility in the GBP/USD currency pair. Market participants will focus on any indications regarding a possible adjustment of the key interest rate. Investors will try to understand how aggressively the BoE intends to fight inflation and what steps it is prepared to take to stimulate economic growth. If Bailey signals readiness to continue pausing in the rate-cutting cycle, this may support the pound. However, if he expresses concern about economic growth prospects, this may negatively affect the British currency.
Regarding the intraday strategy, I will mostly rely on implementing scenarios No. 1 and No. 2.
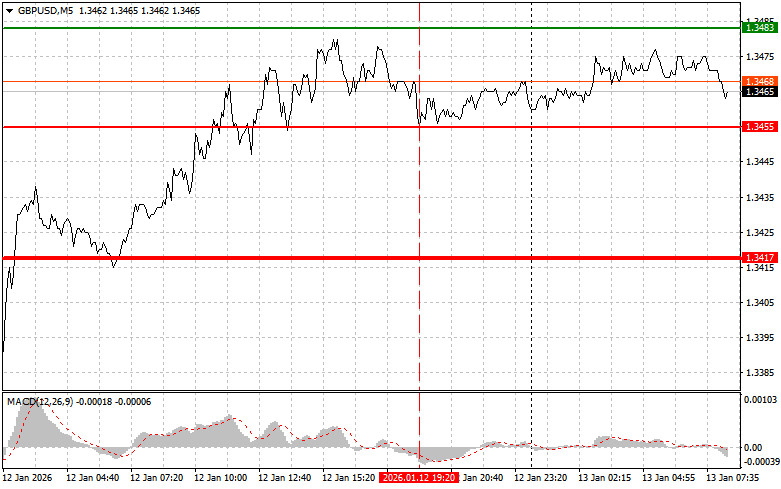
Buy scenarios
Scenario No. 1: I plan to buy the pound today at an entry point around 1.3476 (green line on the chart), targeting a rise to 1.3512 (thicker green line on the chart). Around 1.3512, I intend to exit longs and open short positions in the opposite direction (expecting a 30–35-pip countermove from that level). Expect pound growth today only after a hawkish stance from Bailey. Important! Before buying, make sure the MACD indicator is above the zero line and only beginning to rise from it.
Scenario No. 2: I also plan to buy the pound today in case of two consecutive tests of 1.3455 when the MACD indicator is in the oversold area. This will limit the pair's downside potential and lead to an upward reversal. One can expect a rise toward the opposing levels 1.3476 and 1.3512.
Sell scenarios
Scenario No. 1: I plan to sell the pound today after a break below 1.3455 (red line on the chart), which would trigger a rapid decline in the pair. The key target for sellers will be 1.3417, where I plan to exit shorts and immediately open longs in the opposite direction (expecting a 20–25-pip countermove from that level). Pound sellers may act if the BoE chief takes a dovish stance. Important! Before selling, make sure the MACD indicator is below the zero line and only beginning to decline from it.
Scenario No. 2: I also plan to sell the pound today in case of two consecutive tests of 1.3476 when the MACD indicator is in the overbought area. This will limit the pair's upside potential and lead to a reversal downward. One can expect a decline toward the opposing levels 1.3455 and 1.3417.
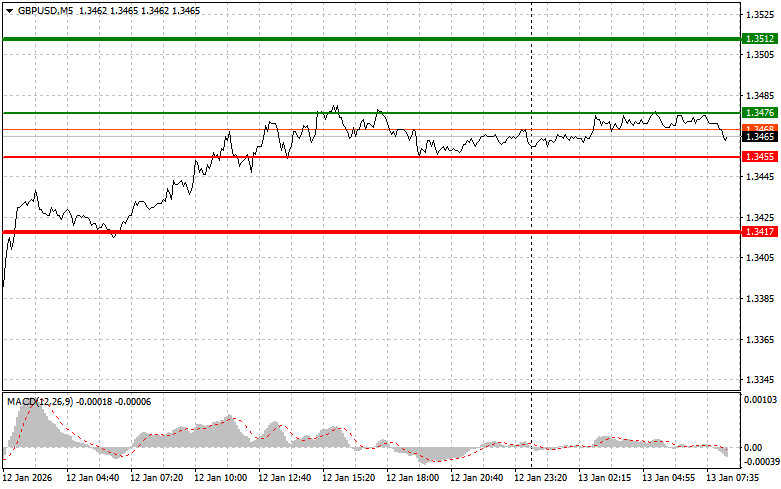
What is on the chart
- Thin green line — entry price at which you can buy the instrument
- Thick green line — suggested Take Profit price or level at which to manually lock in profit, since further rise above this level is unlikely.
- Thin red line — entry price at which you can sell the instrument
- Thick red line — suggested Take Profit price or level at which to manually lock in profit, since further decline below this level is unlikely.
- MACD indicator — when entering the market, it is important to follow the overbought and oversold zones
- Important notes: Beginner forex traders must be very cautious when deciding to enter the market. It is best to be out of the market before major fundamental reports are released to avoid being caught in sharp price swings. If you decide to trade during news releases, always place stop orders to minimize losses. Without stop orders, you can lose your entire deposit quickly, especially if you do not use money management and trade large volumes.
- Remember that successful trading requires a clear trading plan like the one presented above. Spontaneous trading decisions based on current market noise are a losing strategy for the intraday trader.
EURUSD: simple trading tips for beginner traders on January 13. Review of yesterday's Forex trades
.Trade review and trading tips for the European currency
The price test at 1.1696 coincided with the MACD indicator moving far above the zero line, which limited the pair's upward potential. For this reason, I did not buy the euro. The dollar's decline stalled yesterday after some Republican senators criticized Donald Trump, who initiated criminal prosecution against Powell. This unexpected turn of events allowed the dollar to strengthen slightly after the sell-off earlier in the week. Investors seemed tired of the constant attacks on the Federal Reserve's independence, considering Trump's actions more a political maneuver than a real threat to the U.S. economy's stability. However, it is still too early to say the fuss is over. This morning, no economic data from the eurozone is expected. No public statements from European political figures are anticipated either, which may further strengthen dollar buyers' positions. Nevertheless, it is important to note that the dollar's long-term outlook remains uncertain. The growing discussion of a probable slowdown in the U.S. economy and an upcoming cycle of rate cuts is negatively affecting the American currency. In addition, political risks add instability to the market. Therefore, traders are advised to exercise caution. Regarding the intraday strategy, I will mostly rely on scenarios No. 1 and No. 2.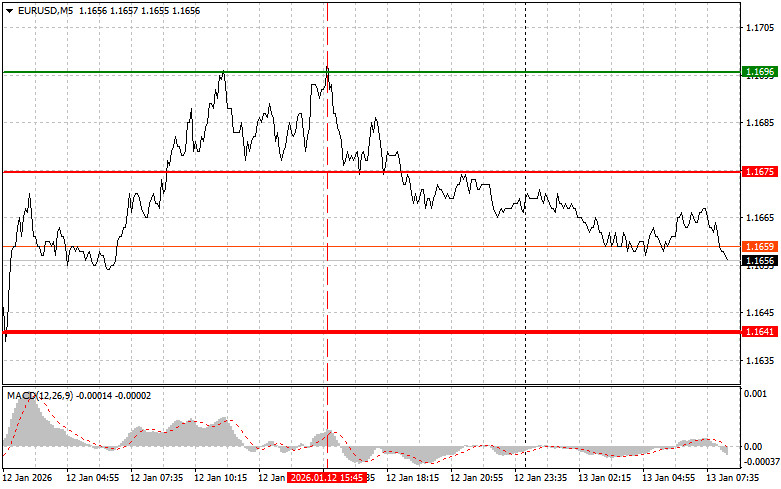
Buy scenarios
Scenario No. 1: Today, the euro can be bought at around 1.1668 (green line on the chart), targeting a rise to 1.1696. At 1.1696, I plan to exit the market and also sell the euro on the rebound, expecting a move of 30–35 pips from the entry point. Expect euro growth only within the channel. Important! Before buying, make sure the MACD indicator is above the zero line and only beginning to rise from it.
Scenario No. 2: I also plan to buy the euro today in case of two consecutive tests of 1.1653 when the MACD indicator is in the oversold area. This will limit the pair's downside potential and lead to an upward reversal. One can expect a rise toward 1.1668 and 1.1696.
Sell scenarios
Scenario No. 1: I plan to sell the euro once it reaches 1.1653 (the red line on the chart). The target will be 1.1633, where I plan to exit the market and buy immediately on the rebound (expecting a 20–25-pip countermove from the level). Pressure on the pair may return quickly today. Important! Before selling, make sure the MACD indicator is below the zero line and only beginning to decline from it.
Scenario No. 2: I also plan to sell the euro today in case of two consecutive tests of 1.1668 when the MACD indicator is in the overbought area. This will limit the pair's upside potential and lead to a reversal downward. One can expect a decline toward 1.1653 and 1.1633.
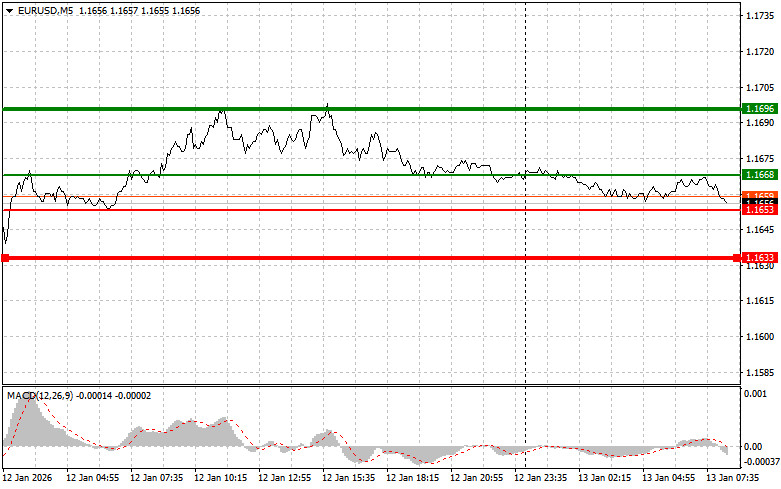
What is on the chart
- Thin green line — entry price at which you can buy the instrument
- Thick green line — suggested Take Profit price or level at which to manually lock in profit, since further rise above this level is unlikely.
- Thin red line — entry price at which you can sell the instrument
- Thick red line — suggested Take Profit price or level at which to manually lock in profit, since further decline below this level is unlikely.
- MACD indicator — when entering the market, it is important to follow the overbought and oversold zones
- Important notes: Beginner forex traders must be very cautious when deciding to enter the market. It is best to be out of the market before major fundamental reports are released to avoid being caught in sharp price swings. If you decide to trade during news releases, always place stop orders to minimize losses. Without stop orders, you can lose your entire deposit quickly, especially if you do not use money management and trade large volumes.
- Remember that successful trading requires a clear trading plan like the one presented above. Spontaneous trading decisions based on current market noise are a losing strategy for the intraday trader.
Test your Forex Trading Knowledge | Forex Quiz Free Online 2026

Think you know something about forex? So, to help you measure just how great your Forex skills are, we have designed a little quiz to test your knowledge. Test your knowledge and skills with our forex trading free online quiz!
Our Forex Quiz contains 10 randomly selected multiple choice questions from a pool containing hundreds of Forex trading and stock market-related topics related questions. Our Forex quiz is absolutely free to use, it’s ad-free and you can use it as often as you like.
Daily Forex and Economic News • Read RSS News Online
Encyclopedia: Forex market analysis
What is fundamental, graphical, technical and wave analysis of the Forex market?
Fundamental analysis of the Forex market is a method of forecasting the exchange value of a company's shares, based on the analysis of financial and production indicators of its activities, as well as economic indicators and development factors of countries in order to predict exchange rates.
Graphical analysis of the Forex market is the interpretation of information on the chart in the form of graphic formations and the identification of repeating patterns in them in order to make a profit using graphical models.
Technical analysis of the Forex market is a forecast of the price of an asset based on its past behavior using technical methods: charts, graphical models, indicators, and others.
Wave analysis of the Forex market is a section of technical analysis that reflects the main principle of market behavior: the price does not move in a straight line, but in waves, that is, first there is a price impulse and then the opposite movement (correction).
Share with friends:
* Frequently asked questions:
What are the risks of Forex trading?
Trading Forex and Leveraged Financial Instruments involves significant risk. As a result of various financial fluctuations (change liquidity, price or high volatility), you may not only significantly increase your capital, but also lose it completely. You should not invest more than you can afford to lose and should ensure that you fully understand the risks involved.


