Daily Forex market analysis - graphical, wave and technical analysis online
Daily Forex* Trade News, Forex market analysis and Economic News online. In this section you will find a fundamental and technical analysis of the Forex market for trading online and Economic News.
Follow the publications of our experts, and you will be able to objectively assess the situation not only on the international currency market Forex, but on all other world trading platforms. With the help of professional analysis of the foreign exchange market, you can invest your money.
Forex Analytics and Daily FX & Economic News • 22 May 2024

Our daily Forex news of the Currency Market is written by industry veterans with years in trading on market Forex. Read the daily analytics, forecasts, technical and fundamental analysis from experts of the Currency, Cryptocurrency and CFD Market online.
Analysis of the GBP/USD pair on May 21, 2024
.For the GBP/USD pair, the wave analysis remains quite complicated. A successful attempt to break through the 50.0% Fibonacci level in April indicated that the market was ready to build a downward wave of 3 or C. If this wave really continues its construction, then the wave pattern will become much simpler and the threat of complication of the wave analysis will disappear. However, in recent weeks, the pair has remained the same, which again makes us doubt the readiness of the market for sales. A downward wave of 3 or c may well be very long, like all previous waves of the current, but still a downtrend section.
In the current situation, my readers can still count on building wave 3 or c, the targets of which are located below the low of wave 1 or a, the mark of 1.2035. Consequently, the British dollar should decrease by at least 600-700 more base points from current levels. With such a decrease, wave 3 or c will turn out to be relatively small, so I expect a much larger drop in quotes. It may take a lot of time to build the entire wave 3 or c. Wave 2 or b has been under construction for 5 months, and this is only a corrective wave. Building a pulse wave can take even longer.
Buyers don't give a single chance to the dollar
The exchange rate of the GBP/USD pair remained virtually unchanged during Monday and Tuesday. Yesterday, Ben Broadbent of the Bank of England said that the regulator may well move to a softer monetary policy this summer, and today, the head of the Bank of England, Andrew Bailey, is due to speak. Whether he confirms Broadbent's words depends on whether the Briton will continue his promotion, which, frankly, is puzzling.
Also, tomorrow morning, the most important UK inflation report for April will be released. It is already extremely difficult to understand what to expect from this report and the market's reaction to it. Inflation may slow down to 2.1%, so the forecast can be considered optimistic. The real value of the indicator is unlikely to be lower than it, but it may well be higher. How does the market interpret the higher value of inflation, provided that it will still decrease very much in April? Let me remind you that the latest report on American inflation caused a decrease in demand for the dollar, despite the slowdown in inflation in accordance with market expectations by only 0.1% year-on-year. I didn't expect to see the dollar fall back then. Therefore, nothing concrete should be expected from the report on British inflation either. The market reaction can be any. Buyers continue to dominate the market, although the Bank of England may come close to its first easing tomorrow. The situation remains ambiguous. The wave pattern can get even more confused.
General conclusions
The wave pattern of the GBP/USD pair still suggests a decline. At the moment, I am still considering selling the pair with targets located below 1.2039, as wave 3 or c has yet to be canceled. A successful attempt to break through the 1.2625 mark, which equates to 38.2% Fibonacci, from above will indicate the possible completion of an internal, corrective wave of 3 or c, which now looks like a classic three-wave.
At the higher wave scale, the wave pattern is even more eloquent. The downward correction section of the trend continues to build, and its second wave has acquired an extended appearance – by 76.4% of the first wave. An unsuccessful attempt to break through this mark could lead to the beginning of building 3 or c, but a corrective wave is currently being built.
The basic principles of my analysis:
1) Wave structures should be simple and understandable. Complex structures are difficult to play out; they often bring changes.
2) If you are not sure what is happening in the market, it is better to avoid entering it.
3) The direction of movement is not absolute, and it can never be. Do not forget about Stop-Loss protection orders.
4) Wave analysis can be combined with other types of analysis and trading strategies.
The material has been provided by InstaForex Company - www.instaforex.com.Analysis of the EUR/USD pair on May 21, 2024
.The wave pattern on the 4-hour chart for EUR/USD remains unchanged. We are observing the construction of the presumed wave 3 in 3 or C of a downward trend segment. If this is the case, the decline in quotes will continue for quite some time, as the first wave of this segment concluded around the 1.0450 mark. Therefore, the third wave of this trend segment should conclude below this level.
The 1.0450 mark is only the target for the third wave. If the current downward trend segment turns out to be impulsive, we can expect five waves, potentially driving the euro below the 1.0000 mark. Admittedly, it isn't easy to anticipate such an outcome, but the forex market has delivered plenty of surprises in recent years. Anything is possible.
Is there a chance of a change in the wave pattern? There always is. However, if we have been observing a new upward trend segment since October 3 of last year, the previous downward wave doesn't fit into any structure. Therefore, an upward segment is possible only with significant complications of the wave pattern. In recent weeks, the pair has only been increasing, threatening the integrity of the wave picture.
The 1.0880 mark is currently holding back buyers.
On Tuesday, the EUR/USD rate decreased by 15 basis points. The overall retreat from the peaks reached last week is only a few dozen points, which is obviously too little to indicate the end of the upward wave observed over the past month. Since I cannot yet conclude that this wave is complete, a breakthrough at 1.0880 remains possible, which would necessitate adjustments to the current wave pattern. Clearly, no one wants this scenario.
However, at the moment, the 1.0880 mark continues to hold off buyers. Unfortunately, sellers are doing almost nothing to start forming a new downward wave, which should be impulsive and drive the pair below the 1.0600 level. Today, FOMC members reiterated that, at best, the regulator will conduct two rounds of monetary easing in 2024. They again cited too high inflation, slow deceleration, and a strong economy. Therefore, the Fed remains as far from the first round of easing now as it was before the release of the April inflation report, which caused the fall of the U.S. dollar.
In the current situation, I can only expect a decrease in demand for the euro and an increase in demand for the dollar. The 1.0880 mark will continue to act as an insurmountable barrier for buyers.
General Conclusions
Based on the EUR/USD analysis, the formation of the downward wave set continues. In the near future, I expect the resumption of the impulsive downward wave 3 in 3 or C with significant declines in the pair. I anticipate a favorable moment for new sales targeting around the estimated mark of 1.0462. A failure to break through the 1.0880 mark, equivalent to 61.8% on the Fibonacci retracement, may indicate the market's readiness for new sales.
On a larger wave scale, it is evident that the presumed wave 2 or B, which exceeded 61.8% on the Fibonacci retracement of the first wave, may be complete. If so, the scenario of forming wave 3 or C and lowering the pair below the 1.0400 level has begun to materialize.
Key Principles of My Analysis:
- Wave structures should be simple and clear. Complex structures are hard to play out and often change.
- If uncertain about market developments, it's better to avoid entering.
- There can never be absolute certainty in the direction of movement. Always use protective Stop Loss orders.
- Wave analysis can be combined with other types of analysis and trading strategies.
Trading Signals for SILVER (XAG/USD) for May 21-25, 2024: sell below $ 32.50 (overbought - 4/8 Murray)
.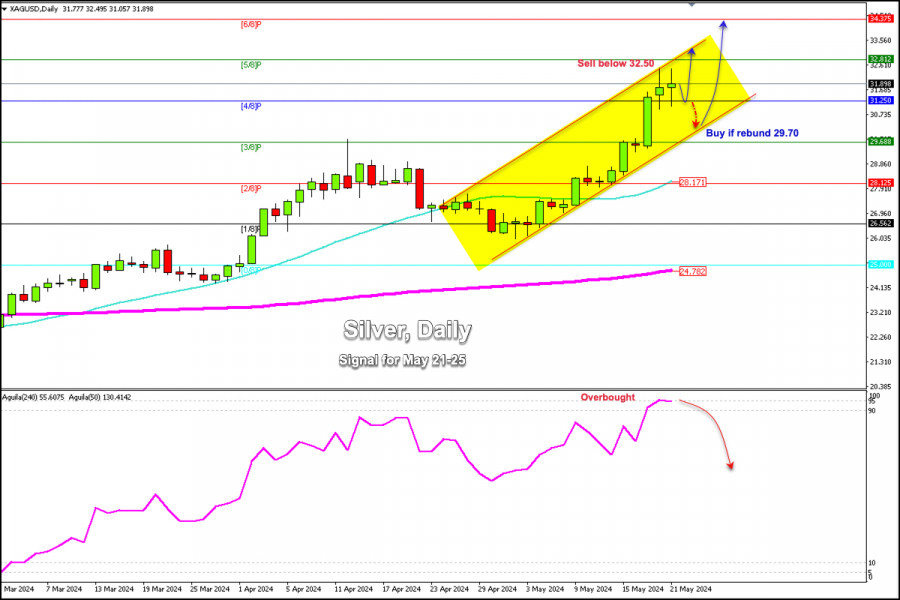
Silver's daily chart shows that it has bullish momentum since April 29. Currently, it is located above 4/8 Murray and is likely to continue rising in the coming days and could reach 32.81 and even 6/8 Murray located at 34.37.
Silver and gold are highly correlated and we can see that the XAG/USD is showing signs of exhaustion. The latest trading session shows indecision in market sentiment. There will likely be a technical correction in the coming days towards the bottom of the uptrend channel located at 29.70.
If silver consolidates above 31.25 (4/8 Murray), the outlook could remain positive. Any technical bounce would help resume the uptrend and the price could reach the top of the uptrend channel around 32.81.
With a sharp break of the uptrend channel and consolidation below the psychological level of $30, we could expect the price to reach the 21 SMA at 28.17. Finally, it could climb to the 200 EMA located at 24.78, which coincides with the psychological level of $25.00.
The eagle indicator is giving overbought signals, so we believe that there could be a technical correction in the next few days. Therefore, we could sell silver below 32.50.
The material has been provided by InstaForex Company - www.instaforex.com.Trading Signals for GOLD (XAU/USD) for May 21-25, 2024: sell below $ 2,435 (21 SMA - 7/8 Murray)
.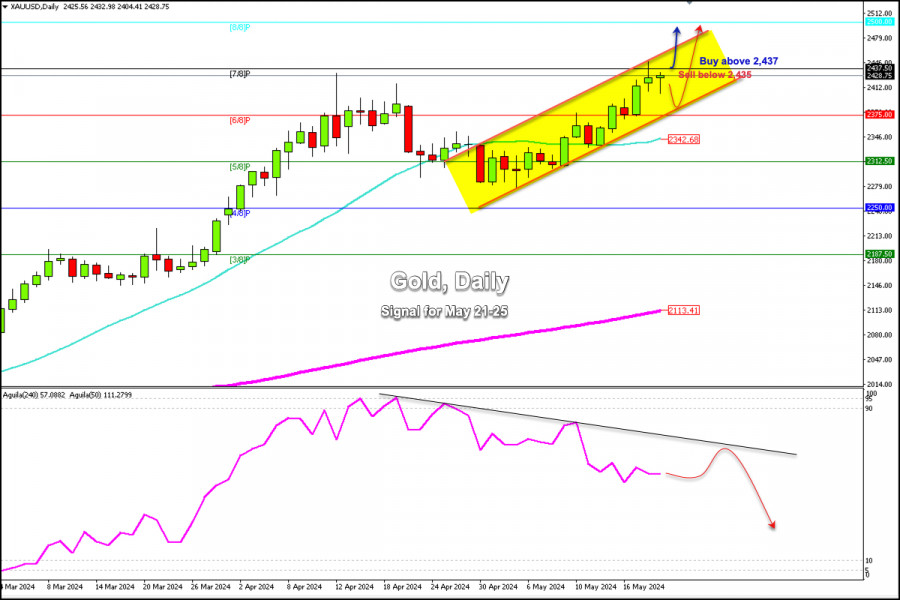
The daily chart shows that gold has been trading within an uptrend channel since April 24 and has bullish potential. So, it could continue to rise in the coming days and reach 8/8 Murray around the psychological level of 2,500.
7/8 Murray can likely be easily overcome by bullish pressure. If the yellow metal consolidates above 2,437, the outlook could remain positive and gold could reach the top of the uptrend channel around 2,465.
If gold makes a technical correction, we could expect it to reach the bottom of the uptrend channel around 2,382. This level could be a good point to resume buying and the price could reach $2,500 in the short term.
On the contrary, if gold falls below 6/8 Murray and consolidates below this zone, it could be seen as a change in the trend and it could reach 2,312 in the short term, 4/8 Murray at 2,250, and even the 200 EMA located at 2,113.
In the meantime, we will look for opportunities to buy gold as long as it trades within the uptrend channel. With any technical bounce above 6/8 Murray, the outlook will remain positive. If gold trades below 2,435 in the next few hours, it will be considered a technical correction. Hence, we could sell.
The material has been provided by InstaForex Company - www.instaforex.com.GBP/USD: trading plan for the US session on May 21st (analysis of morning deals). Buyers target the 1.2722 level
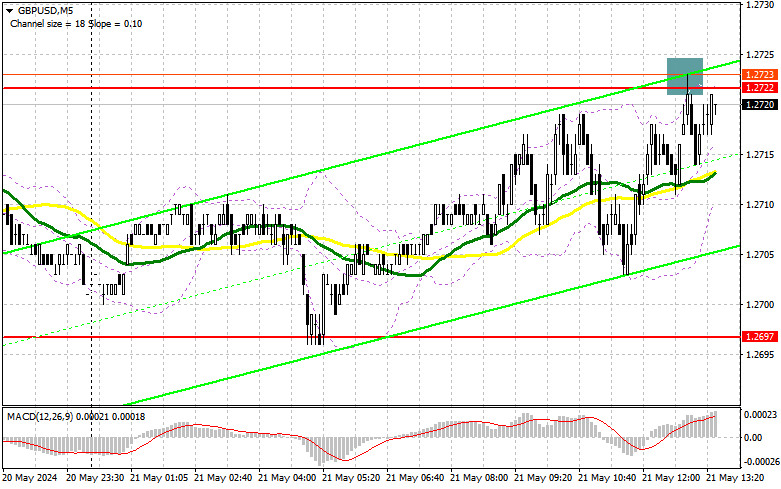
.In my morning forecast, I paid attention to the 1.2720 level and planned to make decisions on entering the market based on it. Let's look at the 5-minute chart and figure out what happened there. Growth and the formation of a false breakdown there gave a sell signal. However, as you can see on the chart, it has yet to reach a major downward movement, although the chances of this are quite good. From a technical point of view, I did not change anything.
To open long positions on GBP/USD, you need:
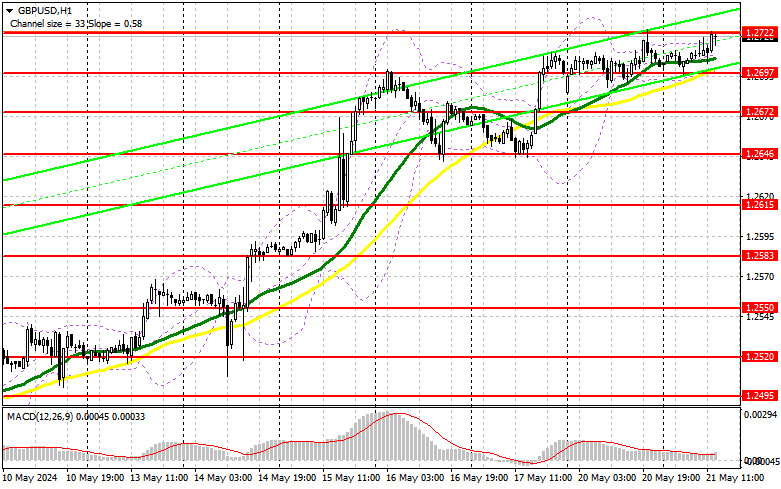
The lack of data on the UK has kept the market on the side of buyers of the pound, who are now trying their best to get above 1.2722. There is a lack of a normal reason, which may be the planned speech by the Governor of the Bank of England, Andrew Bailey. I talked about him in more detail in the morning forecast, so we will not dwell on this. In addition, speeches by representatives of the Federal Reserve System in the person of Christopher Waller, Rafael Bostic, who advocates a softer policy, and FOMC member John Williams are expected. The aggressive tone of politicians will harm the upward potential of the pound, and the market's preparation for a rate cut will allow GBP/USD to continue to grow. In case of a negative reaction, only the formation of a false breakdown in the morning support area of 1.2697 will give an entry point into long positions that can bring the pound back to 1.2722 – a weekly maximum, above which it has not yet been possible to break through in the morning. A rush and a top-down test of this range will determine the chance of GBP/USD growth with the 1.2763 update. In the case of an exit above this range, we can talk about a breakthrough to 1.2800, where I'm going to fix profits. In the scenario of GBP/USD falling and no buyers at 1.2697 in the afternoon, the pressure on the pound will increase, which will lead to a downward movement towards the lower boundary of the 1.2672 side channel. The formation of a false breakdown will be a suitable option for entering the market. It is possible to open long positions on GBP/USD immediately on a rebound from 1.2646 in order to correct 30-35 points within a day.
To open short positions on GBP/USD, you need:
In case of a bullish reaction to the speech of representatives of the Federal Reserve System, I'm going to act around the weekly high of 1.2722, from where the pound fell once yesterday. The formation of a false breakdown there, by analogy with yesterday, will lead to an excellent entry point into short positions in order to reduce GBP/USD to the support area of 1.2697, where the moving averages playing on the side of the bulls are located. A breakout and a reverse test from the bottom up of this range will increase the pressure on the pair, giving the bears an advantage and another entry point to sell with the aim of updating 1.2672, where I expect a more active manifestation of buyers. A longer-range target will be a minimum of 1.2646, which will negate all the efforts of the bulls last week. I will fix the profit there. With the option of GBP/USD growth and the absence of bears at 1.2722 in the afternoon, and so far everything is going to this, buyers will have the opportunity to build a bull market further and update the level of 1.2763. I will also serve there only on a false breakdown. In the absence of activity there, I advise you to open short positions on GBP/USD from 1.2800, counting on the pair's rebound down by 30-35 points within the day.
Indicator Signals:
Moving Averages
Trading is conducted above the 30 and 50-day moving averages, indicating further pound growth.
Note: The period and prices of the moving averages considered by the author are on the hourly H1 chart and differ from the general definition of classic daily moving averages on the D1 daily chart.
Bollinger Bands
In case of a decline, the lower boundary of the indicator, around 1.2697, will act as support.
Indicator Descriptions:
- Moving Average: Identifies the current trend by smoothing volatility and noise. Period 50. Marked in yellow on the chart.
- Moving Average: Identifies the current trend by smoothing volatility and noise. Period 30. Marked in green on the chart.
- MACD Indicator (Moving Average Convergence/Divergence): Fast EMA period 12. Slow EMA period 26. SMA period 9.
- Bollinger Bands: Period 20.
- Non-commercial traders: Speculators such as individual traders, hedge funds, and large institutions use the futures market for speculative purposes and meet specific requirements.
- Long non-commercial positions: Represent the total long open position of non-commercial traders.
- Short non-commercial positions: Represent the total short open position of non-commercial traders.
- Total non-commercial net position: The difference between the short and long positions of non-commercial traders.
EUR/USD: trading plan for the US session on May 21st (analysis of morning deals). The euro hit 1.0870
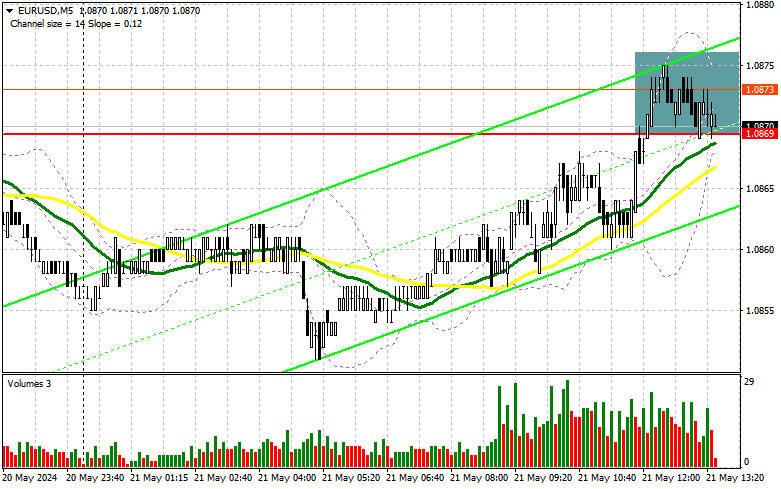
.In my morning forecast, I paid attention to the 1.0869 level and planned to make decisions on entering the market from it. Let's take a look at the 5-minute chart and figure out what happened there. Growth to this level occurred, but it never reached the formation of a false breakdown there. Obviously, it is not possible to enter the sale from this level yet, so the whole denouement is postponed to the afternoon. At the same time, I did not revise the technical picture.
To open long positions on EURUSD, you need:
Unfortunately, in the afternoon, there is nothing but a speech by representatives of the Federal Reserve System again. How the market will react to speeches by Treasury Secretary Janet Yellen, FOMC members Christopher Waller and Rafael Bostic is a mystery. But one thing is certain: euro buyers will not have a quiet life during today's American session. If the bulls allow the sell scenario from 1.0869 to be realized, then the market can definitely turn around. For this reason, I will consider purchases after the decline and the formation of a false breakdown in the area of 1.0838, which will be a suitable option to enter with the expectation of another increase in the area of 1.0869. A breakout and a top-down update of this range after the speech of the Fed representatives will lead to a strengthening of the pair with a chance of a breakthrough to 1.0893 – week high. The farthest target will be a maximum of 1.0918, where I will record profits. If EUR/USD declines and there is no activity around 1.0838 in the afternoon, the pressure on the market will increase, which will lead to a larger drop in the pair to the 1.0805 area. I'm also going to enter there only after the formation of a false breakdown. I plan to open long positions immediately for a rebound from 1.0778 with the aim of an upward correction of 30-35 points within the day.
To open short positions on EURUSD, you need:
Sellers have every chance to keep the market in the side channel and to return the initiative. To do this, you need to show yourself in the resistance area of 1.0869 and return trading to this level. Together with the false breakdown and hawkish statements by the Fed representatives, we can count on short positions with the prospect of a decline in the euro and an update of support at 1.0838. A breakout and consolidation below this range, as well as a reverse bottom-up test, will give another selling point with the pair moving to the low of 1.0805, where I expect to see a more active manifestation of buyers. The farthest target will be a minimum of 1.0778, where I will record profits. In the event of an upward movement of EUR/USD in the afternoon, as well as the absence of bears at 1.0869, the development of the bullish trend will continue. In this case, I will postpone the sale until the test of the next resistance at 1.0893. I will also sell there, but only after an unsuccessful consolidation. I plan to open short positions immediately for a rebound from 1.0918 with the aim of a downward correction of 30-35 points.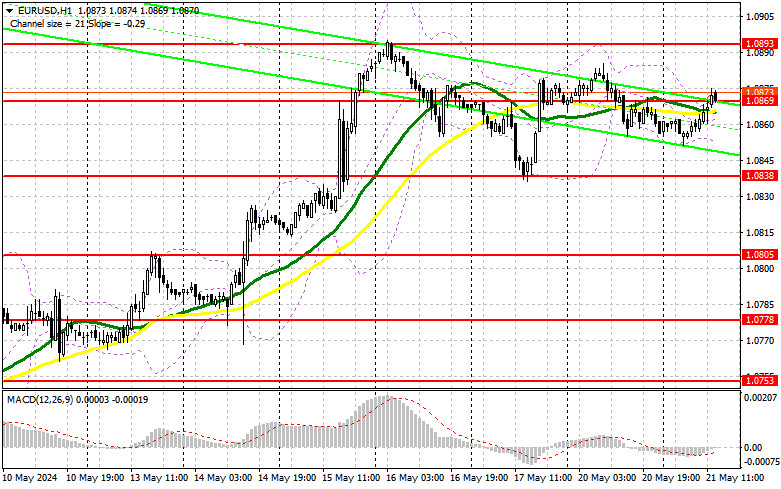
Indicator signals:
Moving averages
Trading is conducted around the 30 and 50-day moving averages, indicating market uncertainty.
Note: The period and prices of the moving averages considered by the author are on the hourly H1 chart and differ from the general definition of classic daily moving averages on the D1 daily chart.
Bollinger Bands
In case of a decline, the lower boundary of the indicator around 1.0860, will act as support.
Indicator Descriptions:
- Moving Average: Identifies the current trend by smoothing volatility and noise. Period 50. Marked in yellow on the chart.
- Moving Average: Identifies the current trend by smoothing volatility and noise. Period 30. Marked in green on the chart.
- MACD Indicator (Moving Average Convergence/Divergence): Fast EMA period 12. Slow EMA period 26. SMA period 9.
- Bollinger Bands: Period 20.
- Non-commercial traders: Speculators such as individual traders, hedge funds, and large institutions using the futures market for speculative purposes and meeting specific requirements.
- Long non-commercial positions: Represent the total long open position of non-commercial traders.
- Short non-commercial positions: Represent the total short open position of non-commercial traders.
- Total non-commercial net position: The difference between non-commercial traders' short and long positions.
Forecast of EUR/USD pair on May 21, 2024
.On Monday, the EUR/USD pair reversed in favor of the US dollar and began a new decline toward the corrective level of 61.8% (1.0837). A rebound from this level would favor the euro and lead to some growth towards the 76.4% Fibonacci level at 1.0892. Consolidation below the 1.0837 level would favor further decline towards the support zone at 1.0785–1.0797. However, the "bullish" trend will remain intact even if the pair falls into this zone.
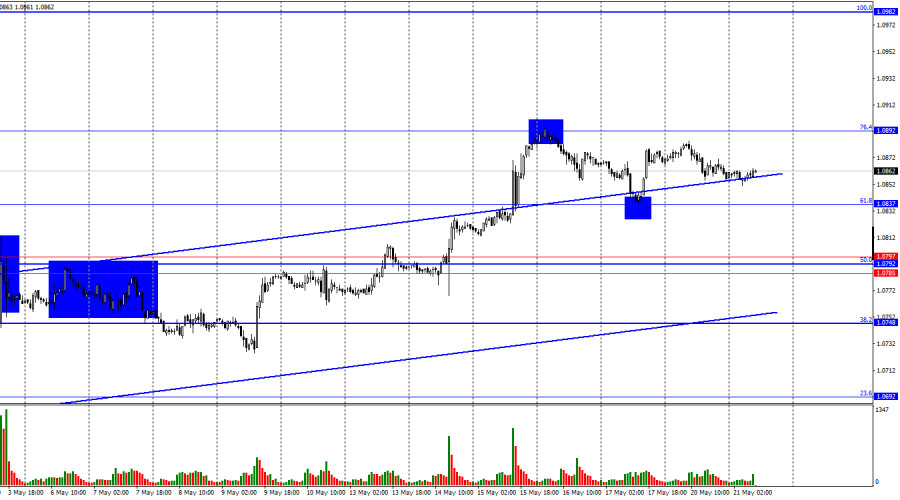
The wave situation remains unchanged. The last downward wave ended on May 1 and failed to reach the low of the previous wave, while the new upward wave has already broken the peak of the previous wave and has been forming for 13 days. Thus, a "bullish" trend has formed, and bullish traders are attacking almost daily. I find this trend rather unstable and wonder if it will last long. Nonetheless, the upward movement continued for a month, and bears could not push the pair even to the lower boundary of the channel. Therefore, there are no signs of the "bullish" trend ending.
There was no informational background on Monday, which explains the very low trader activity. Additionally, low trader activity has been observed for quite some time, which hasn't prevented the euro from showing steady growth. Therefore, it is more accurate to speak of weak bull activity and the absence of bear activity, which have ensured the euro's growth almost daily. I do not expect strong movements since there was no new information on Monday. There will also be a few news releases on Tuesday, so the euro might continue fluctuating between the 1.0837 and 1.0892 levels. Bulls are waiting for the right moment to make a new advance, while bears have no desire to attack.
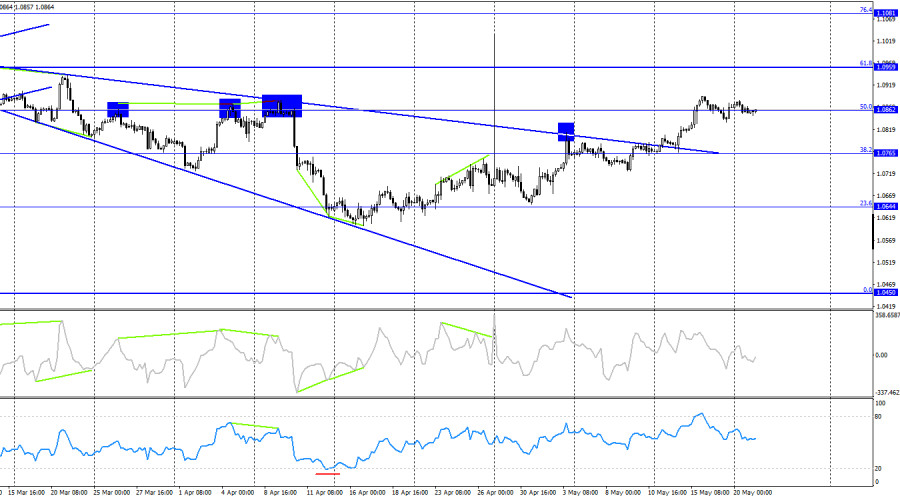
On the 4-hour chart, the pair consolidated above the "wedge" and rose to the 50.0% Fibonacci level at 1.0862. The latest phase of the euro's growth seems ambiguous, so I am unsure of its continuation. However, sell signals are needed to expect a decline, and there are currently none. No emerging divergences were observed today, either. The growth process might continue towards the next corrective level at 61.8%–1.0959. The only factor against the euro is the overbought RSI indicator (above +80).
Commitments of Traders (COT) Report:
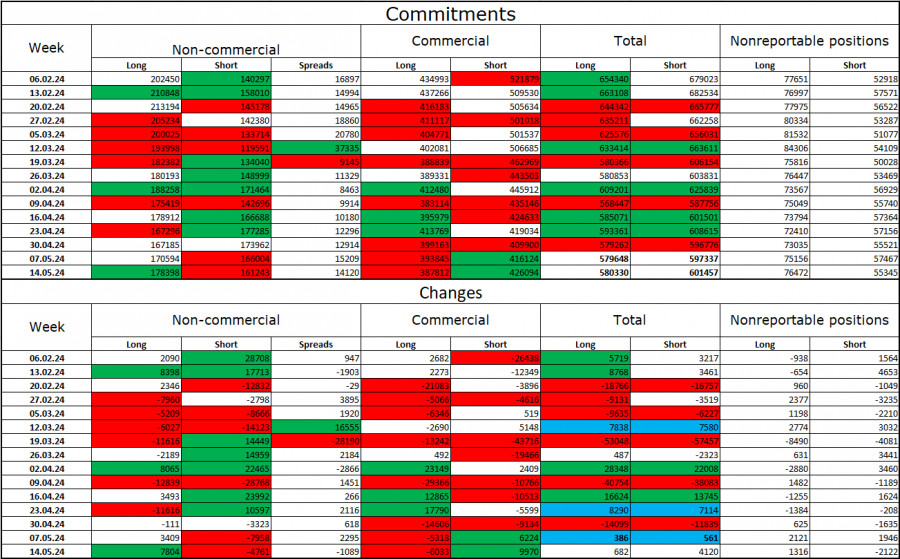
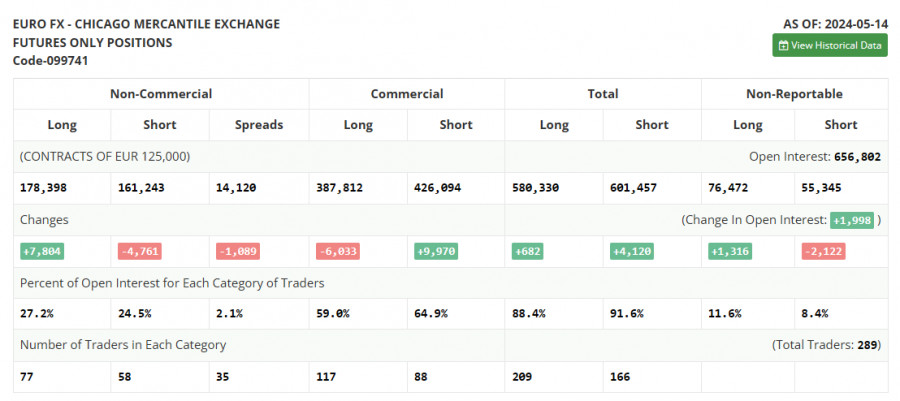
In the last reporting week, speculators opened 7,804 long contracts and closed 4,761 short contracts. The sentiment of the "non-commercial" group turned "bearish" several weeks ago, but now bulls have the upper hand again. The total number of long contracts speculators hold is now 178 thousand, while short contracts amount to 161 thousand. However, the situation will continue to shift in favor of the bears. The second column shows that the number of short positions has increased from 140 thousand to 161 thousand over the past three months. Long positions decreased from 202 thousand to 178 thousand during the same period. Bulls have dominated the market for too long, and now they need strong informational support to resume the "bullish" trend. A series of poor reports from the US has supported the euro, but more is needed for the long term.
News Calendar for the US and the EU:
The economic events calendar does not contain any entries on May 21. Therefore, the impact of the informational background on trader sentiment will be absent today.
Forecast for EUR/USD and Trader Recommendations:
Selling the pair was possible when quotes rebounded from the 1.0892 level on the hourly chart, with targets at 1.0837 and the lower boundary of the ascending channel. The first target has been reached. New sales are possible upon a rebound from the 1.0892 level with the same targets. Buying the euro was possible upon a rebound from the 1.0837 level on the hourly chart with a target of 1.0892. This target has been nearly reached. New purchases can be considered on a new rebound from 1.0837 or upon closing above 1.0892 with a target of 1.0982.
The material has been provided by InstaForex Company - www.instaforex.com.GBP/USD. May 21st. The pound awaits "dovish" statements from Bailey to continue its growth
.On the hourly chart, the GBP/USD pair traded within the 1.2690–1.2705 range on Monday, and only today did it consolidate above this range. Since there was no rebound from this zone, the growth process might continue toward the next resistance zone at 1.2788–1.2801. Consolidation below the 1.2690–1.2705 zone will favor the US dollar and lead to a potential decline toward the 1.2611 level.
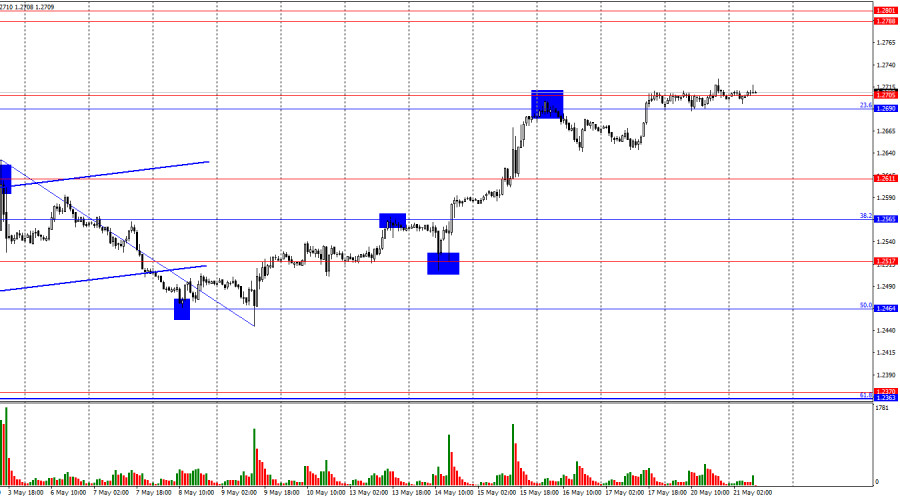
The wave situation remains unchanged. The last downward wave ended on May 9 and did not break the low of the previous wave, while the new upward wave broke the peak on May 3. Thus, the trend for the GBP/USD pair has shifted to a "bullish" trend and remains so. However, the "bullish" trend might be short-lived, as I don't consider the current informational background strong enough for the pound to see several more upward waves. Nevertheless, the first sign of the end of the "bullish" trend will only appear when a new downward wave breaks the low of the previous wave from May 9. For this to happen, the pound must fall 250–280 points from the current price.
The pound continues to grow almost without pause. Even on Monday, when traders were reluctant to trade, the pound gained little. Today, Bank of England Governor Andrew Bailey is set to speak. His speech will occur in the evening, and trader activity might again be very weak during the day. However, bulls anticipate supportive comments. What might these comments include? First, Bailey could state that the Bank of England must still be ready to start easing monetary policy. Second, the inflation report for April, which will be released tomorrow morning, will be known after this evening. This report could show a significant slowdown in inflation in Britain, but before its release, bulls might launch a final attack. The inflation report may not trigger bear activity, as it has been extremely weak recently, but there is a formal reason to expect a decline tomorrow.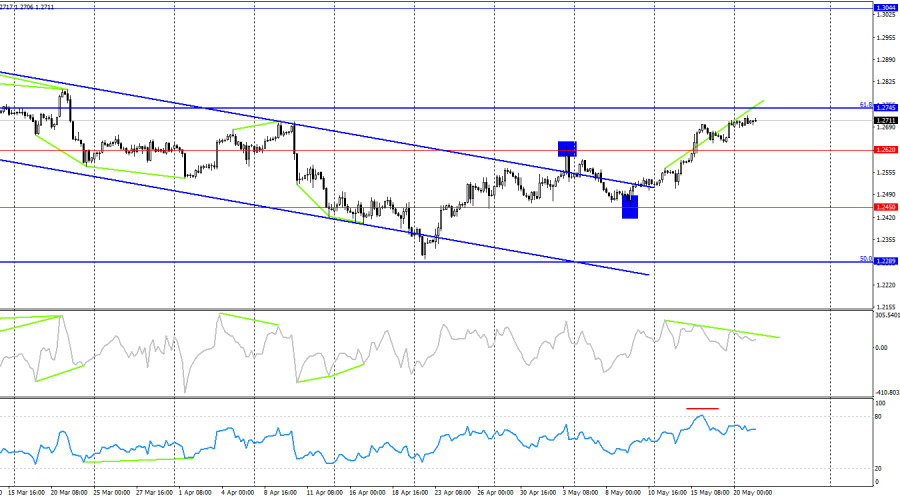
On the 4-hour chart, the pair has consolidated above the 1.2620 level, allowing for continued growth towards the 1.2745 correction level. I need help to imagine an informational background that would continue to support the bulls. However, it cannot be denied that the pound may continue to rise as it has exited the descending trend channel. A rebound from the 1.2745 level might cool down the bulls, who have been very aggressive lately. The emerging "bearish" divergence is strong and increases the likelihood of a rebound from the 1.2745 level.
Commitments of Traders (COT) Report:
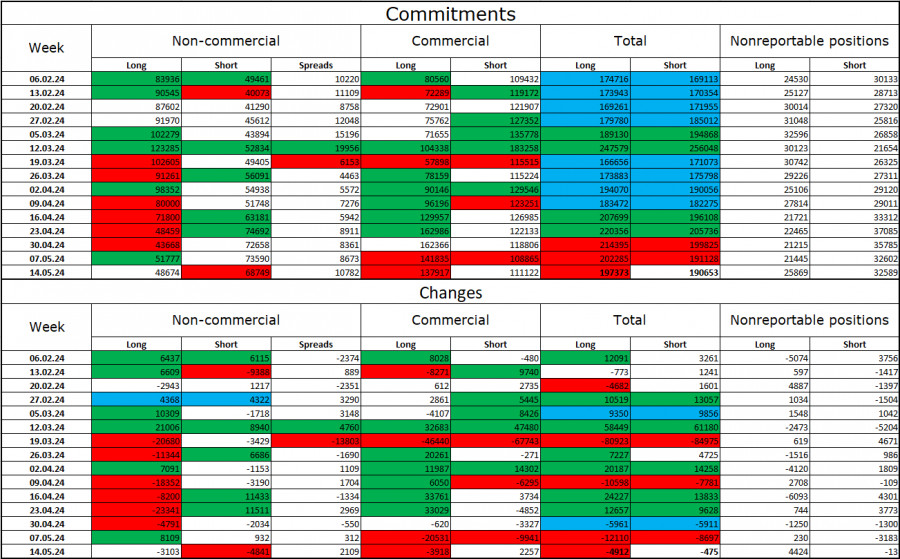
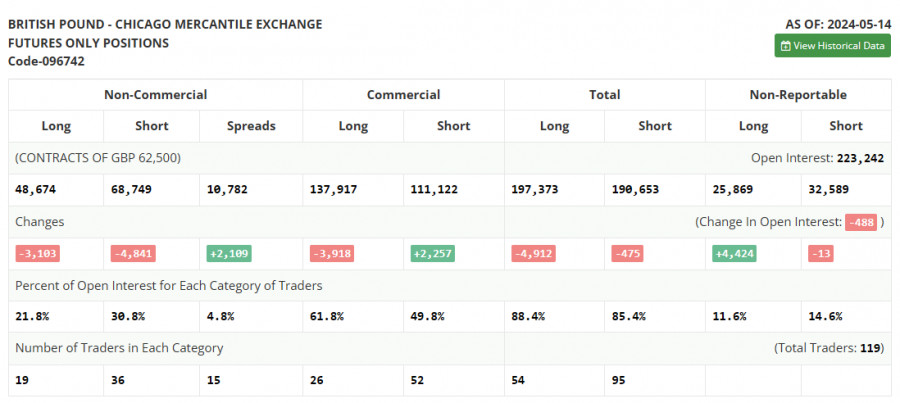
The sentiment among "non-commercial" traders has become less "bearish" over the past reporting week. The number of long contracts held by speculators decreased by 3,103, while the number of short contracts decreased by 4,841. The overall sentiment of large players has shifted, and now the bears are dictating their terms in the market. The gap between the long and short contracts is 20 thousand: 48 thousand versus 68 thousand.
The pound still faces prospects of decline. Over the past three months, the number of long positions has decreased from 83 thousand to 48 thousand, while the number of short positions has increased from 49 thousand to 68 thousand. Over time, bulls will continue to reduce their buy positions or increase their sell positions, as all possible factors supporting the British pound have already been accounted for. Bears have demonstrated weakness and complete reluctance to attack in recent months, but I expect the pound to start falling.
News Calendar for the US and UK:
United Kingdom – Speech by Bank of England Governor Andrew Bailey (17:00 UTC).
On Tuesday, the economic events calendar contains a few interesting entries. The influence of the informational background on market sentiment will be absent for the rest of the day.
Forecast for GBP/USD and Trader Recommendations:
Selling the pound was possible when closing below the resistance zone on the hourly chart at 1.2690–1.2705, with targets at 1.2611 and 1.2565. Buying can be considered when closing above the 1.2705 level with a target of 1.2788–1.2801. Alternatively, buying can be considered in case of a rebound from the 1.2611 level on the hourly chart with a target of the 1.2690–1.2705 zone.
The material has been provided by InstaForex Company - www.instaforex.com.Nasdaq records highs and S&P rises: All eyes on Nvidia
.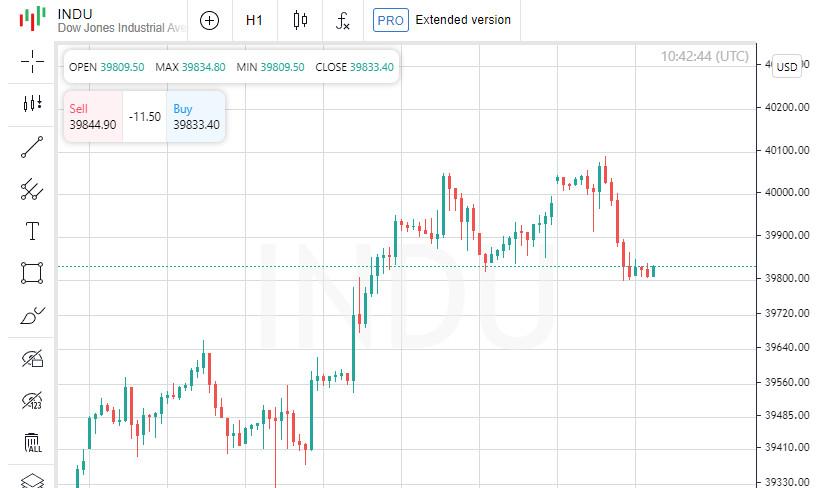
The Nasdaq hit record highs on Monday, while the S&P 500 posted modest gains as technology stocks advanced, ahead of Nvidia's results. The market also assessed the likelihood of interest rate cuts by the Federal Reserve.
Among the S&P's major sectors, technology .SPLRCT led the pack, rising 1.32%, led by gains from chipmakers including Nvidia, which rose 2.49% ahead of its quarterly earnings report.
Investors are looking at Nvidia's earnings to see whether the artificial intelligence leader will maintain its rapid growth and advantage over rivals.
Several brokerages increased their targets for Nvidia, and Micron Technology (MU.O) shares rose 2.96% after Morgan Stanley upgraded its rating to "equal weight" from "underweight." The PHLX Semiconductor Index (.SOX) rose 2.15%.
Stephen Massocca, a senior vice president at San Francisco-based Wedbush Securities, said: "If Nvidia's results exceed expectations, it could cause a bit of a stir. However, given the high cost, significant growth is unlikely."
"A Fed rate cut could spark a rally, but current data doesn't yet support that scenario."
The Dow Jones Industrial Average (.DJI) fell 196.82 points, or 0.49%, to 39,806.77. While the S&P 500 Index (.SPX) rose 4.86 points, or 0.09%, to 5,308.13, and the Nasdaq Composite Index (.IXIC) rose 108.91 points, or 0.65%. , closing at 16,794.87.
The Dow's decline came as JPMorgan (JPM.N) shares fell 4.5% after CEO Jamie Dimon expressed "cautious pessimism" and noted that the company has no plans to buy back shares at current prices.
A strong earnings season and signs of slowing inflation have reignited expectations that the Federal Reserve will cut interest rates this year, pushing major indexes to record levels. Let's remember that last week the Dow Jones index (.DJI) exceeded 40,000 points for the first time.
Fed officials' comments on Monday had little impact on interest rate forecasts, despite their insistence that inflation pressures were easing and emphasizing the importance of a cautious approach.
The minutes of the Federal Reserve's latest monetary policy meeting are scheduled to be released on Wednesday. Markets estimate the chance of a rate cut of at least 25 basis points at the September meeting at 63.3%.
The latest stock market rally has raised concerns about lofty stock valuations, with the S&P 500 trading at a P/E ratio of 20.8, well above its historical average of 15.9, according to LSEG.
Deutsche Bank raised its end-2024 forecast for the S&P 500 to 5,500 from a previous 5,100, the highest expected level among leading brokerages. In turn, Morgan Stanley predicts that the index will reach 5,400 points by June 2025.
Shares of the Norwegian cruise line (NCLH.N) rose 7.56% after the company raised its full-year profit forecast. On the New York Stock Exchange, advancing stocks outnumbered declining ones by a ratio of 1.14 to 1. At the same time, on the Nasdaq, declining stocks outnumbered advancing ones by a ratio of 1.01 to 1.
The S&P 500 has recorded 58 new highs and four new lows over the past 52 weeks, while the Nasdaq has posted 222 new highs and 101 new lows. Trading volume on US exchanges reached 12.31 billion shares, exceeding the last 20 trading days' average of 11.82 billion.
Asian markets were lower and the dollar held steady on Tuesday ahead of the release of minutes from the Federal Reserve's latest meeting, which could provide clues about the timing and extent of a potential interest rate cut this year.
Gold prices retreated from Monday's record high and oil prices fell on concerns that U.S. interest rates could remain high for a long time due to the Federal Reserve's cautious approach to the recent decline in inflation.
Cryptocurrencies including ether and bitcoin hit new six-week highs amid speculation the US Securities and Exchange Commission (SEC) could approve a spot exchange-traded fund (ETF) for ether.
MSCI's index of Asia-Pacific shares outside Japan .MIAPJ0000PUS was down 0.9% after the Hang Seng retreated 1.9% from its multi-month high hit on Monday.
Japan's Nikkei (.N225), which tracks technology stocks, subsequently edged 0.1% lower after rising to record highs overnight.
Nasdaq futures fell 0.06%, while S&P 500 futures remained steady after rising 0.1% the previous day.
"Market sentiment continues to remain relatively stable with low implied volatility, supported by confidence in the possibility of US interest rate cuts this year," Kyle Rodda, senior markets analyst at Capital.com, said in an analysis.
In addition, record price levels for metals such as gold and copper "act as indicators of a pick-up in economic activity around the world, which in turn could act as a headwind for inflation," Rodda added.
Gold fell 0.3% to around $2,417 an ounce, after first rising to $2,450 overnight.
The dollar held its ground against major currencies, with the dollar index remaining at 104.62, recovering from a five-week low of 104.07 recorded on Thursday.
The 10-year U.S. Treasury yield was little changed at 4.4433% after rising 1.7 basis points on Monday.
Brent crude fell 0.7% to $83.17 a barrel, while U.S. West Texas Intermediate (WTI) crude fell 0.7% to $79.22 a barrel.
At the same time, after the announcement that the Securities and Exchange Commission (SEC) unexpectedly required exchanges wishing to trade Ethereum ETFs to update their regulatory documents, traders were actively purchasing cryptocurrencies. The development raised expectations that approval for trading could come as soon as this week, sending the market to new highs.
Bitcoin hit $71,957 while Ethereum rose to $3,720.80, both setting highs not seen since April 9.
"Expectations regarding the approval of the Ethereum ETF have significantly impacted market activity, adding to the already growing bullish trend in the cryptocurrency space. The move gained further momentum after lower-than-expected US CPI data was released last week," said IG analyst Tony Sycamore.
Sycamore predicts that Bitcoin could soon again reach its all-time high of $73,803.25 and possibly even surpass the $80,000 mark.
The material has been provided by InstaForex Company - www.instaforex.com.Video market update for May 21, 2024
.Potential for the further drop on Us Indices....
The material has been provided by InstaForex Company - www.instaforex.com.Forex forecast 05/21/2024: EUR/USD, AUD/USD, NZD/USD, USD/CAD and Bitcoin from Sebastian Seliga
.We introduce you to the daily updated section of Forex analytics where you will find reviews from forex experts, up-to-date monitoring of financial information as well as online forecasts of exchange rates of the US dollar, euro, ruble, bitcoin, and other currencies for today, tomorrow and this trading week.
Video Agenda:
00:00 INTRO
00:15 Totay's key events: RBA Meeting Minutes, Trade Balance, Eurogroup Meetings, FOMC Member Williams Speaks, BoE Gov Bailey Speaks, API Weekly Crude Oil Stock
01:46 EUR/USD
04:03 AUD/USD
05:55 NZD/USD
08:01 USD/CAD
09:43 BTC/USD
Useful links:
My other articles are available in this section
InstaForex course for beginners
Important:
The begginers in forex trading need to be very careful when making decisions about entering the market. Before the release of important reports, it is best to stay out of the market to avoid being caught in sharp market fluctuations due to increased volatility. If you decide to trade during the news release, then always place stop orders to minimize losses.
Without placing stop orders, you can very quickly lose your entire deposit, especially if you do not use money management and trade large volumes. For successful trading, you need to have a clear trading plan and stay focues and disciplined. Spontaneous trading decision based on the current market situation is an inherently losing strategy for a scalper or daytrader.
#instaforex #analysis #sebastianseliga
The material has been provided by InstaForex Company - www.instaforex.com.Trading plan for EUR/USD on May 21. Simple tips for beginners
.Analyzing Monday's trades:
EUR/USD on 1H chart
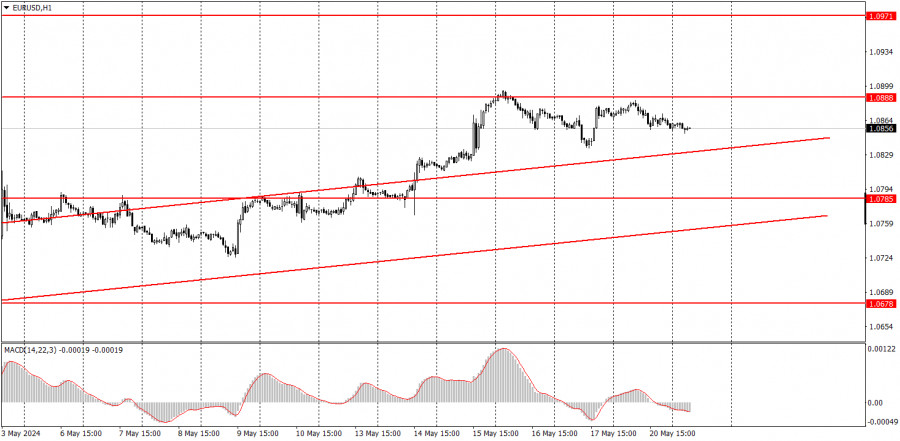
EUR/USD continued to hover near its local highs throughout Monday. Bears lack the strength to start a correction at the moment, so the pair simply moves sideways, slightly below the 1.0888 level. No important or even secondary events in both the EU and the US. The pair's volatility was just around 30 pips, which proves that there was nothing to analyze.
The euro frequently continues to rise without any reasons or grounds. Take note that the European Central Bank's first rate cut is scheduled for next month, so the euro should have turned downwards and started a decline. The ECB's rate is 1% lower than the Federal Reserve's rate, and the gap between them will widen further from June onwards. Therefore, we still believe that the pair should sharply move to the downside, and it should last for a long time. However, the upward movement persists, which is still considered a correction and has been ongoing for over a month. There are currently no technical signals to change the trend.
EUR/USD on 5M chart
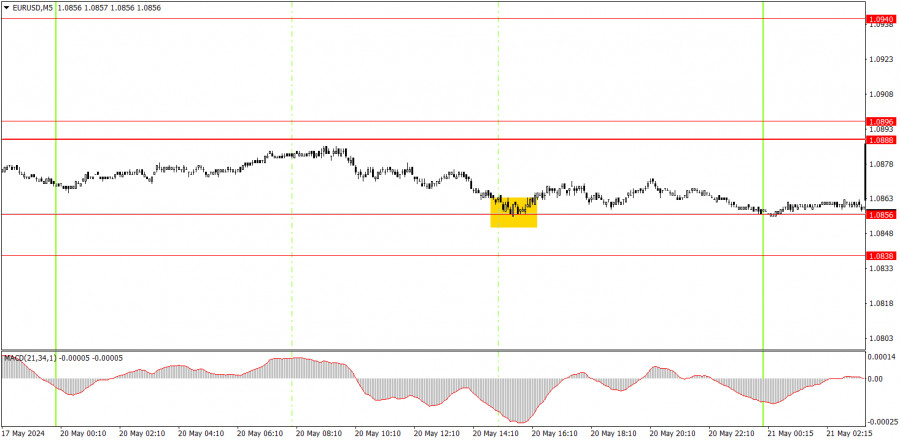
There's no point in assessing the trading signals on the 5-minute timeframe. It wasn't even worth looking for them since volatility was quite low, and the price practically moved sideways all day. However, during the beginning of the US trading session, the pair rebounded from the 1.0856 level, but the price didn't even rise by 10 pips. Once again, we will remind you that if there's no movement in the market, no trading signal will bring profit.
Trading tips on Tuesday:
On the hourly chart, the EUR/USD pair continues to correct higher, which increasingly resembles an independent trend. We believe that the decline should resume in the medium term, as the euro remains expensive, and the overall trend is downward. However, for unknown reasons, the market refuses to buy the dollar. Perhaps a new strong downward trend is just around the corner.
On Tuesday, novice traders can look for signals around the areas of 1.0838-1.0856 and 1.0888-1.0896 and 1.0888-1.0896. These are fairly strong areas that can generate both buy and sell signals.
The key levels on the 5M chart are 1.0483, 1.0526, 1.0568, 1.0611, 1.0678, 1.0725-1.0733, 1.0785-1.0797, 1.0838-1.0856, 1.0888-1.0896, 1.0940, 1.0971-1.0981. Today, there are no significant events lined up in the US and the EU, so we'll likely face another boring day.
Basic trading rules:
1) Signal strength is determined by the time taken for its formation (either a bounce or level breach). A shorter formation time indicates a stronger signal.
2) If two or more trades around a certain level are initiated based on false signals, subsequent signals from that level should be disregarded.
3) In a flat market, any currency pair can produce multiple false signals or none at all. In any case, the flat trend is not the best condition for trading.
4) Trading activities are confined between the onset of the European session and mid-way through the U.S. session, after which all open trades should be manually closed.
5) On the 30-minute timeframe, trades based on MACD signals are only advisable amidst substantial volatility and an established trend, confirmed either by a trendline or trend channel.
6) If two levels lie closely together (ranging from 5 to 15 pips apart), they should be considered as a support or resistance zone.
How to read charts:
Support and Resistance price levels can serve as targets when buying or selling. You can place Take Profit levels near them.
Red lines represent channels or trend lines, depicting the current market trend and indicating the preferable trading direction.
The MACD(14,22,3) indicator, encompassing both the histogram and signal line, acts as an auxiliary tool and can also be used as a signal source.
Significant speeches and reports (always noted in the news calendar) can profoundly influence the price dynamics. Hence, trading during their release calls for heightened caution. It may be reasonable to exit the market to prevent abrupt price reversals against the prevailing trend.
Beginners should always remember that not every trade will yield profit. Establishing a clear strategy coupled with sound money management is the cornerstone of sustained trading success.
The material has been provided by InstaForex Company - www.instaforex.com.Trading Signals for GBP/USD for May 21-23, 2024: sell below 1.2685 (21 SMA - symmetrical triangle)
.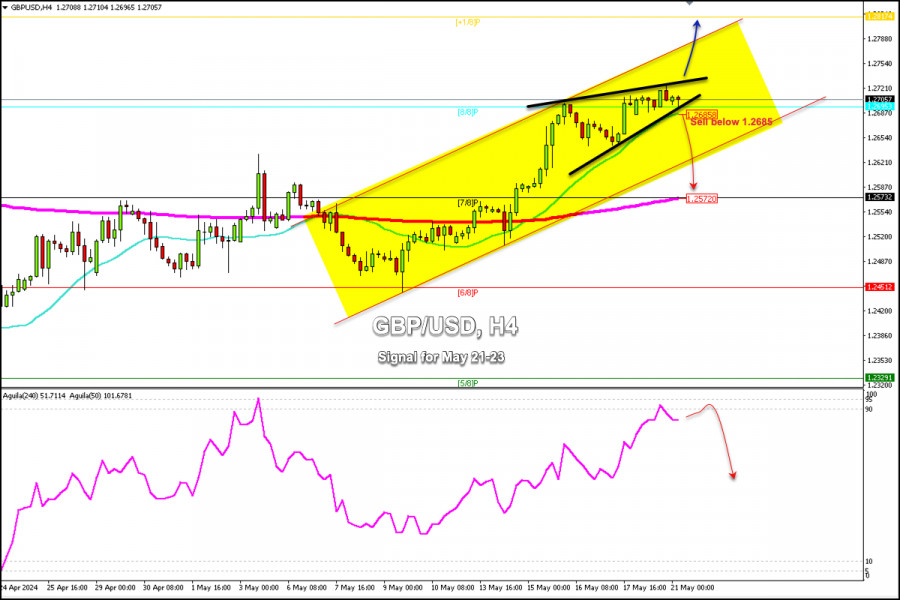
Early in the European session, the British Pound (GBP/USD) is trading around 1.2705 within a symmetrical triangle pattern and within the uptrend channel forming on the H4 chart since May 7.
The British pound could break sharply the symmetrical triangle pattern in the next few hours and we could expect a drop. This scenario will be valid only if GBP/USD breaks and consolidates below the 21 SMA around 1.2685, then it could reach the 200 EMA located at 1.2572.
On the contrary, in case the British pound consolidates above the weekly high of 1.2730 or makes a break above the symmetrical triangle, we could expect there to be a continuation of the bullish movement and the instrument could reach +1/8 Murray located at 1.2817 or could reach the top of the uptrend channel around 1.2770.
The British pound has been consolidating at about 1.27 since May 15. Above this area, the outlook could be positive. Below this zone, we could expect a technical correction as the eagle indicator is generating an overbought signal.
Our trading plan for the next few hours is to sell the British pound only in case it falls below 1.2685, with targets at 1.2620, 1.2573, and the psychological level of 1.2500.
The material has been provided by InstaForex Company - www.instaforex.com.Technical Analysis of Intraday Price Movement of AUD/CAD Cross Currency Pairs,Tuesday May 21, 2024.
.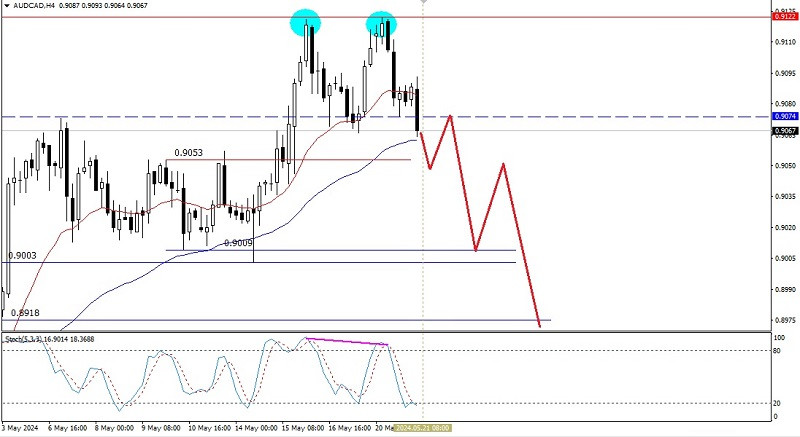
If we look at the 4-hour chart of the AUD/CAD cross currency pair, we will see a deviation between the price movement which forms the Double Top and the Stochastic Oscillator indicator, even though the 20 EMA is still above the 50 EMA, but the appearance of this deviation gives an indication that in the near future AUD/CAD has the potential to be corrected down, where the level of 0.9053 will be tested in the near future. If this level is successfully broken downwards, then 0.9009 will be the main target to be aimed at and if the momentum and volatility are supportive then the level of 0.8918 will be the next target that will be tried to be tested. However, if on its way to these levels suddenly strengthening occurs which penetrates above the 0.9122 level then all the scenarios previously described will become invalid and automatically cancel themselves.
(Disclaimer)
The material has been provided by InstaForex Company - www.instaforex.com.Technical Analysis of Intraday Price Movement of NZD/USD Commodity Currency Pairs, Tuesday May 21, 2024.
.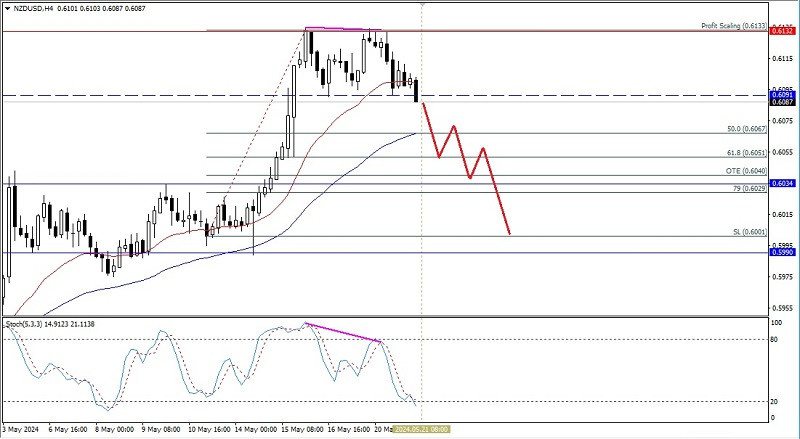
Even though on the 4-hour chart the NZD/USD 20 EMA commodity currency pair is above the 50 EMA, which indicates that Buyers still dominate the current market, the appearance of deviations between Kiwi price movements and the Stochastic Oscillator indicator gives a hint that in the near future NZD/USD has the potential to corrected to weaken, where the 0.6067 level will try to be tested and broken downwards. If this level is successfully break downwards, the Kiwi will continue its decline to the 0.6040 level and if the momentum and volatility are supportive then the 0.6001 level will be the next target to be aimed at, but all of these scenarios can become invalid if on its way to these targets suddenly the Kiwi strengthens again until it breaks above the 0.6133 level.
(Disclaimer)
The material has been provided by InstaForex Company - www.instaforex.com.Forecast for EUR/USD on May 21, 2024
.EUR/USD
Yesterday, the euro closed slightly lower, clearly influenced by the stock market, which fell during the second half of the US session. Overall, the euro continues its attempts to reach the target level of 1.0905. It started the day by trading higher, although the Marlin oscillator is currently decreasing.
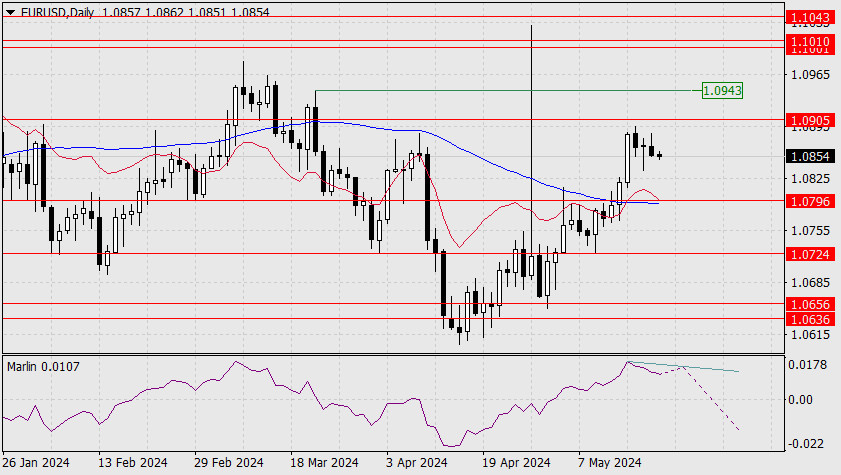
If the euro reaches the designated level, it will form a divergence with the oscillator, providing a classic reversal signal.
On the 4-hour chart, the price approached the MACD line. If it consolidates below this, below the 1.0850 mark, it will indicate the price's intention to test the support at 1.0796.
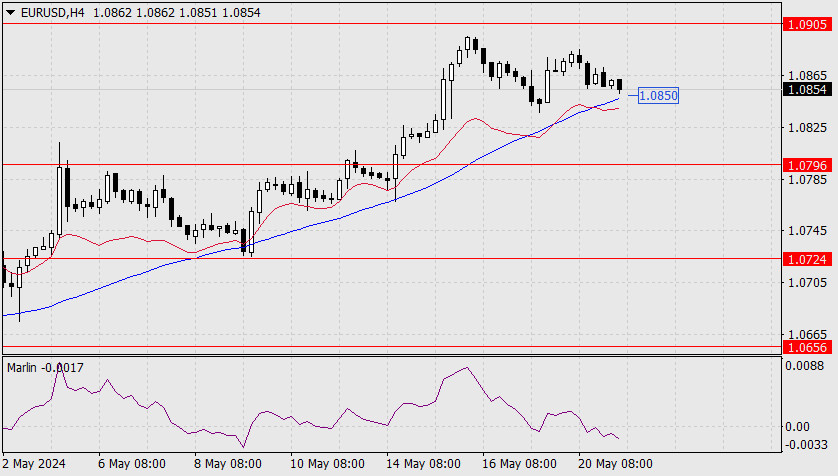
The signal line of the Marlin oscillator managed to settle below the zero line, increasing the probability of the price breaking below the MACD line. However, we have an uptrend on the daily chart, so a sharp decline may turn out to be a false movement within the context of a complicated sideways correction.
The material has been provided by InstaForex Company - www.instaforex.com.Forecast for GBP/USD on May 21, 2024
.GBP/USD
Yesterday, the pound performed well against the backdrop of a broad weakness of counter-dollar currencies, as it managed to gain 4 pips. The Marlin oscillator is moving sideways on the daily timeframe, almost reversing, so the price may start a medium-term decline from the level of 1.2745 with a higher probability than from the level of 1.2790 – from the upper boundary of the descending price channel.
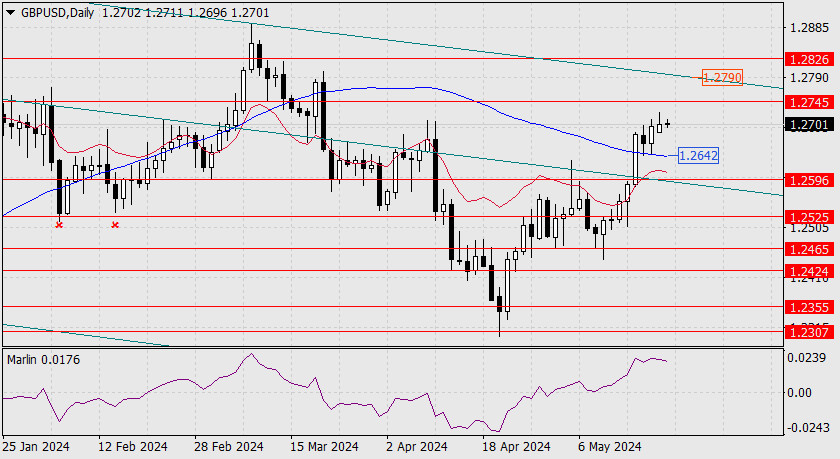
On the 4-hour chart, the hypothetical divergence has become more complicated, but overall, the outlook remains unchanged. An uptrend in the short-term, and Marlin is ready for a short-term reversal to the upside.
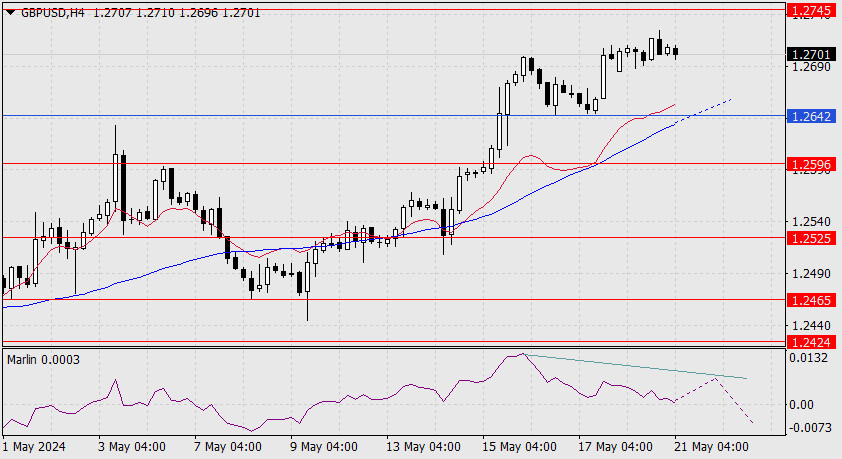
The MACD line has come even closer to the level of 1.2642 – to the MACD line on the daily chart, strengthening this key area. If the price falls below it, it will be an important sign of a price reversal to a medium-term decline.
The material has been provided by InstaForex Company - www.instaforex.com.Forecast for USD/JPY on May 21, 2024
.USD/JPY
Yesterday, the dollar dominated over the yen, rising by 60 pips, surpassing the target level of 155.75 and the 50% Fibonacci level (156.03). Now, the price is aiming for the 61.8% Fibonacci level at 157.00.
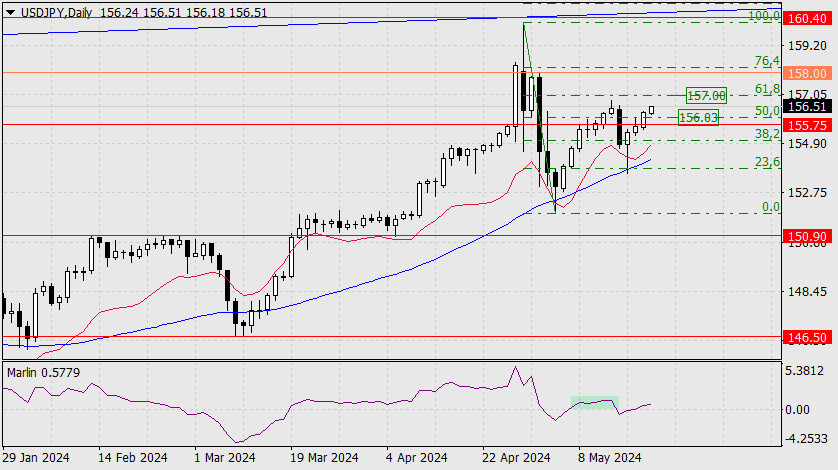
However, one concerning factor is the Marlin oscillator's weakness. Its signal line has barely entered the positive territory and has already gone sideways. This could repeat the pattern from May 9-15 (marked by a rectangle on the oscillator chart). The price has a good chance of falling, we'll find out whether this will take place from the 157.00 level or the 158.00 level.
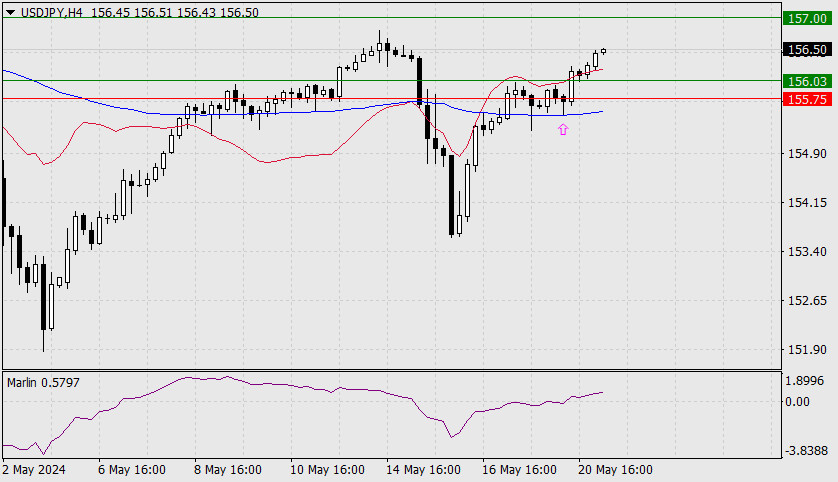
On the 4-hour chart, the price has consolidated above the balance and MACD indicator lines, as the Marlin oscillator consolidated in the uptrend territory and continues to rise. Take note that yesterday, the price moved upwards from the MACD line (arrow), so there is a high chance that the price will reach the target level of 157.00.
The material has been provided by InstaForex Company - www.instaforex.com.Will the dollar start a reversal?
.The euro managed to take the opponent's serve when the US dollar weakened against major global currencies following the release of US inflation data for April. Will the greenback be able to make a comeback? The FOMC meeting minutes are far from the key event of the week leading up to May 24. Reports on European wages and business activity are much more important. The serve is in the hands of the EUR/USD bulls, but will they be able to capitalize on it?
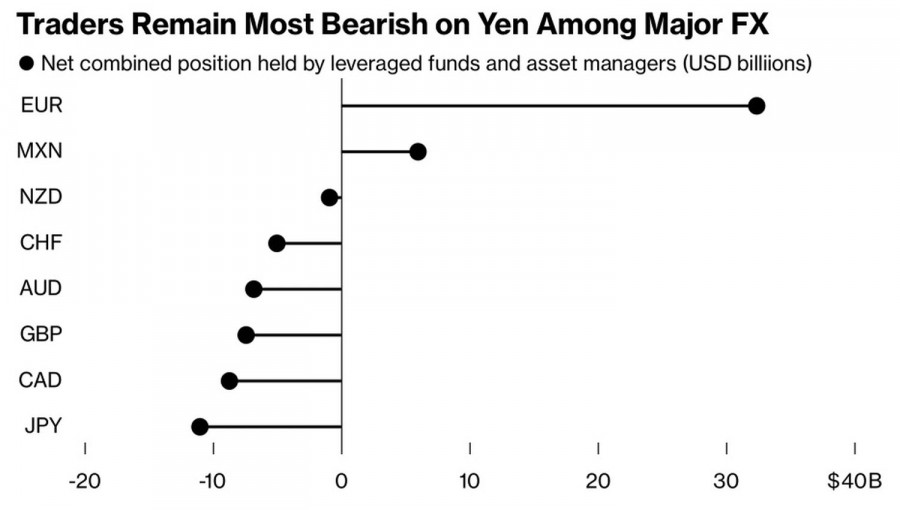
The flight of investors from the US dollar resulted in an increase in speculative long positions in other global currencies. One of the main beneficiaries has been the euro. Hedge funds and asset managers have been snapping up the regional currency like hotcakes, even faster than the super-peso from Mexico.
Speculator positions in Forex
It is clear that the European Central Bank's rate cut in June has been fully priced in. Moreover, Governing Council officials are not rushing to continue the cycle of monetary policy easing. The head of the Bank of Slovenia, Bostjan Vasle, noted that further actions will depend on data. German official Isabel Schnabel even stated that based on current data, a rate cut in July does not seem warranted. It is necessary to look at wage dynamics, productivity, and how higher costs are being passed on by companies to the economy.
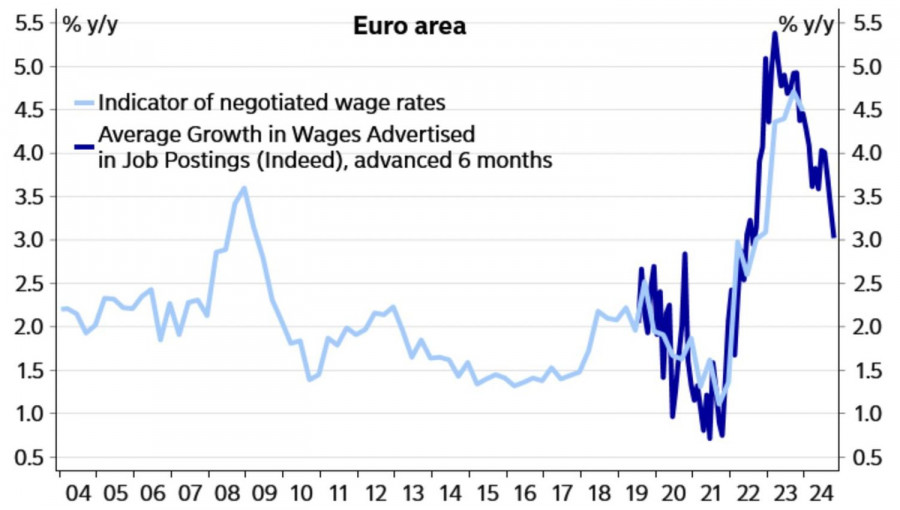
In this regard, the data on harmonized wages in the eurozone could be a strong argument in favor of buying the euro or, conversely, might force the bulls to retreat. UniCredit forecasts that in the first quarter, the figure will slow from 4.5% to 4.2%. If this does not happen, a rate cut in July will become problematic.
Dynamics of European wages and inflation
The dynamics of European business activity for May is equally intriguing. It provides insight not only into the GDP for the second quarter but also into the divergence in economic growth. It is no secret that the divergence has been the main driver behind the reversal of the downward trend in EUR/USD. If the actual data exceeds Bloomberg experts' expectations for PMI growth to 46.2 in the manufacturing sector and 53.4 in the services sector, the major currency pair will surge.
As for the minutes of the FOMC meeting from April 30 to May 1, these are lagging data. By that time, the Federal Reserve did not have figures for the labor market or April inflation. The central bank was concerned about accelerating consumer prices, so a hawkish tone is not out of the question. However, it is unlikely to scare financial markets. Much has changed since then.
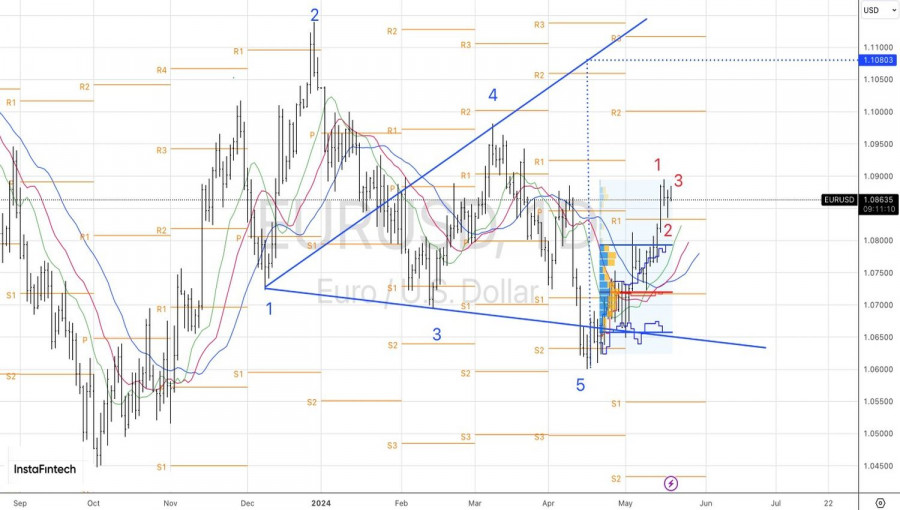
Technically, on the daily chart, the EUR/USD might activate the 1-2-3 reversal pattern, signaling the start of a corrective downward movement. The key point is a breakthrough of the support at 1.083. If the bears manage to do this, short-term short positions will become interesting. As long as the pair trades above this pivot level, we stick to a buying strategy with a target based on the Wolfe Wave pattern at 1.108.
The material has been provided by InstaForex Company - www.instaforex.com.Trading Signals for EUR/USD for May 20-22, 2024: sell below 1.0864 (21 SMA - 6/8 Murray)
.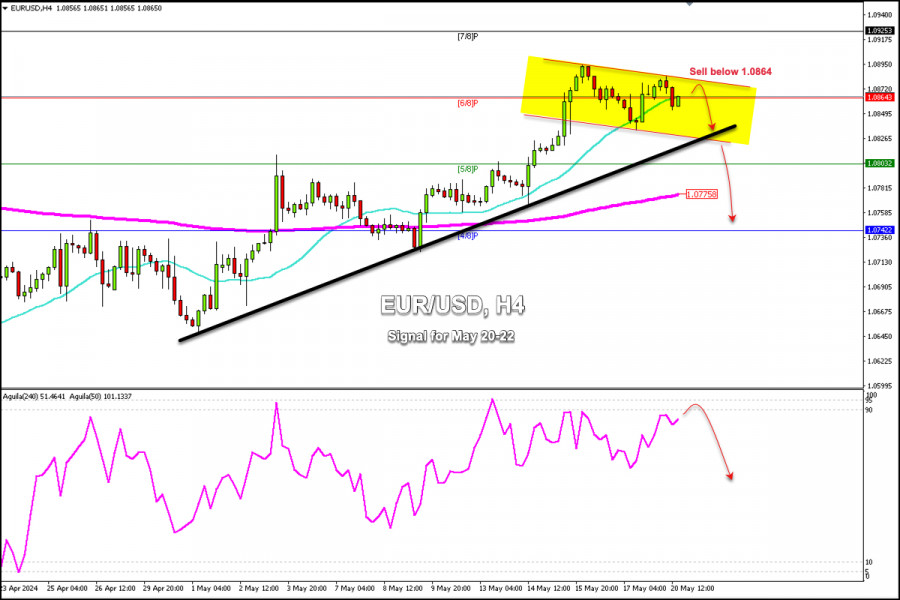
EUR/USD is trading around 1.0864, showing signs of exhaustion. The instrument has found strong resistance around 6/8 Murray. On the H4 chart, the euro was generating a strong bullish signal during the European session, but a technical correction is now unfolding because it was rejected from the top of the bearish channel around 1.0883.
If the euro falls below 1.0864 in the next few hours, it will be seen as an opportunity to sell, with targets in the uptrend channel at around 1.0828.
A sharp break of the uptrend channel forming since April 29 and a consolidation below 1.0820 will be seen as a trend change. So, the euro could quickly reach the 200 EMA and even the 4/8 Murray located at 1.0742.
The eagle indicator has been in an overbought zone since May 13. We believe that for the euro to resume its bullish cycle, there should be a strong technical correction and EUR/USD could even reach support levels of 1.0750. Once it gets relief, the instrument could resume its upward trend.
If the euro finds a good bottom around 1.0725, it will be seen as an opportunity to buy with targets at 1.0925 (7/8 Murray) and at the psychological level of 1.10.
The material has been provided by InstaForex Company - www.instaforex.com.Trading Signals for GOLD (XAU/USD) for May 20-22, 2024: buy above $2,413 or sell below $2,437 (21 SMA - 7/8 Murray)
.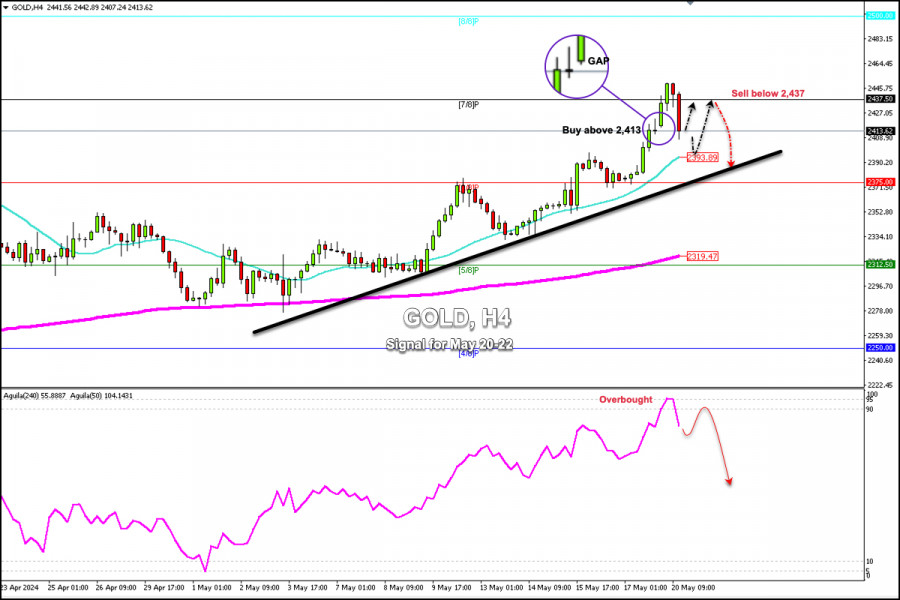
In the American session, Gold (XAU/USD) is trading around 2,413, below the 7/8 Murray, and above the 21 SMA. During the European session, the metal reached a high at about 2,449. Currently, we see that gold is covering the GAP it left at 2,312. There will likely be a technical bounce and gold may resume its bullish cycle and reach 7/8 Murray again around 2,437.
If gold attempts to break through 7/8 Murray and fails to consolidate above this area, it will be seen as an opportunity to resume selling as the eagle indicator signals the extremely overbought market.
The geopolitical data and investor fear is reflected in gold as it is a safe-haven asset. The market is likely to remain volatile over the next few days, so we should be careful when trading as an excessive increase in our risk appetite could harm our capital.
Meanwhile, we will look for opportunities to buy above 2,413. Besides, if gold falls towards 2,393 (21 SMA), it will be seen as an opportunity to buy.
On the other hand, a pullback towards 2,437 will be seen as an opportunity to sell below this area, with targets at 2,393 and 2,375.
Our trading plan for the next few hours is to wait for gold to reach resistance zones above 2,427 towards 2,437. This area will be seen as a signal to sell. The eagle indicator supports our bearish strategy and we believe that gold will make a strong technical correction in the coming days.
The material has been provided by InstaForex Company - www.instaforex.com.Analysis of GBP/USD pair on May 20th
.For the GBP/USD pair, wave analysis remains quite complex. A successful attempt to break through the Fibonacci level of 50.0% in April indicated the market's readiness to build a downward wave 3 or c. If this wave continues to develop, the wave pattern will become much simpler, and the threat of complicating the wave analysis will disappear. However, in recent weeks, the pair's decline has been absent, prompting doubts about the market's readiness for sales. The downward wave 3 or c could be very extensive, like all previous waves of the current, but it is still a downward trend segment.
In the current situation, my readers can still count on wave 3 or c formation, the targets of which are located below the low of wave 1 or a, at the level of 1.2035. Therefore, the pound should decline by at least 600–700 basis points from current levels. With such a decline, wave 3 or c will be relatively small, so I expect a much larger decline in quotes. It may take a lot of time to build the entire wave 3 or c. Wave 2 or b took five months to form, and it was only a corrective wave. Building an impulse wave may take even more time.
Monday passes without changes.
The GBP/USD pair remained unchanged throughout Monday, and the range of movements when writing the review is ten basis points. This means that there were no movements today. This is consistent with the news background, which was also weak today. Nevertheless, I cannot mention Ben Broadbent's speech stating that the Bank of England could start lowering interest rates as early as this summer. Undoubtedly, he also mentioned that everything would depend on the incoming data, hinting that inflation may not be as positive as the markets and the Bank of England expect.
And the market's positivity and optimism are overwhelming right now. According to forecasts, inflation in Britain may slow to 2.1% in April annually, which may be known as early as Wednesday. At the same time, core inflation may decrease to 3.6%. If this forecast is true, the Bank of England could move to a more "dovish" policy in June or August. Inflation could be higher than 2.1%, but such an optimistic forecast alone means we are in for a very strong slowdown, as the current inflation rate is 3.2%.
Based on the above, I still expect a decline in demand for the pound. The Fed will start easing in the fall and more likely - in winter. Therefore, sellers may take the initiative in the market for the next few months.
General Conclusions.
The wave pattern of the GBP/USD pair still suggests a decline. At this time, I am still considering selling the pair with targets below the 1.2039 level, as wave 3 or c has yet to be canceled. A successful attempt to break through the 1.2625 level, which equates to 38.2% Fibonacci, from above will indicate the possible completion of the internal, corrective wave within 3 or c, which looks like a classic three-wave structure.
On a larger wave scale, the wave pattern is even more eloquent. The descending correctional trend segment continues to develop, and its second wave has acquired an extended form - to 76.4% of the first wave. An unsuccessful attempt to break this level could have led to the beginning of the construction of 3 or c, but at this time, a corrective wave is being built.
The main principles of my analysis:
- Wave structures should be simple and understandable. Complex structures are difficult to play with, often bringing changes.
- If there is confidence in what is happening in the market, it is better to avoid entering it.
- There is never 100% certainty in the direction of movement. Remember protective stop-loss orders.
- Wave analysis can be combined with other types of analysis and trading strategies.
Video market update for May 20, 2024
.Potential for the further rally on dollar index....
The material has been provided by InstaForex Company - www.instaforex.com.USD/JPY: Simple trading tips for novice traders for May 20th (US session)
.Trade analysis and tips for trading the Japanese yen
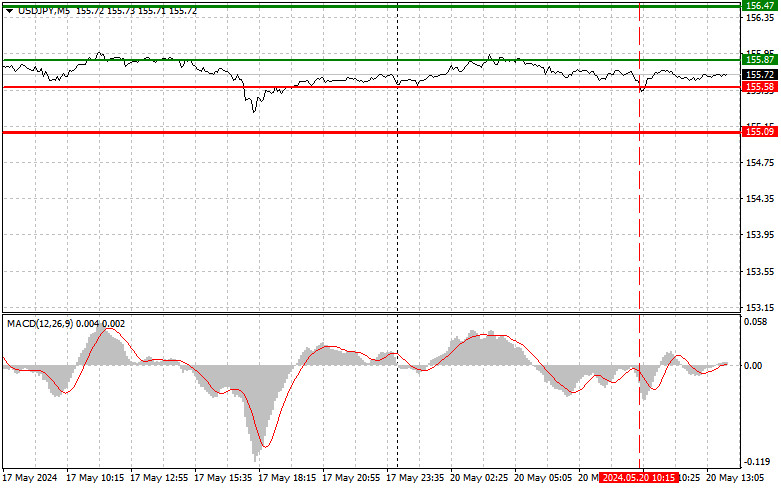
The price test at 155.58 occurred when the MACD had significantly dropped below the zero mark, limiting the pair's further downward potential. For this reason, I did not sell the dollar, and I was right. There was no downward movement, and trading continued within a sideways channel. Considering that no important statistics are expected in the second half of the day and the speech by FOMC member Christopher Waller is unlikely to have a decisive impact on the market, it is best to focus on the further development of the upward trend in the pair, taking advantage of pullbacks, which are quite likely due to interventions by the Bank of Japan. As for the intraday strategy, I plan to act based on implementing Scenarios 1 and 2.
Buy Signal
Scenario 1: Today, I plan to buy USD/JPY upon reaching the entry point around 155.87 (green line on the chart), with a target of rising to the 156.47 level (thicker green line on the chart). At around 156.47, I will exit purchases and open sales in the opposite direction (aiming for a movement of 30-35 points in the opposite direction from the level). Today, you can expect the pair to rise to continue the trend, but strong movement is unlikely. Important! Before buying, ensure the MACD indicator is above the zero mark and starting to rise.
Scenario 2: I also plan to buy USD/JPY today in case of two consecutive tests of the 155.48 price when the MACD indicator is in the oversold area. This will limit the pair's downward potential and lead to an upward market reversal. You can expect a rise to the opposite levels of 155.87 and 156.47.
Sell Signal
Scenario 1: Today, I plan to sell USD/JPY after the level of 155.48 is updated (red line on the chart), leading to a rapid decline in the pair. The key target for sellers will be the 154.83 level, where I will exit sales and immediately open purchases in the opposite direction (aiming for a movement of 20–25 points in the opposite direction from the level). Pressure on the pair will return in case of failure to consolidate around the daily maximum. Important! Before selling, please ensure the MACD indicator is below the zero mark and starting to decline.
Scenario 2: I also plan to sell USD/JPY today in case of two consecutive tests of the 155.87 price when the MACD indicator is in the overbought area. This will limit the pair's upward potential and lead to a market reversal downward. You can expect a decline to the opposite levels of 155.48 and 154.83.
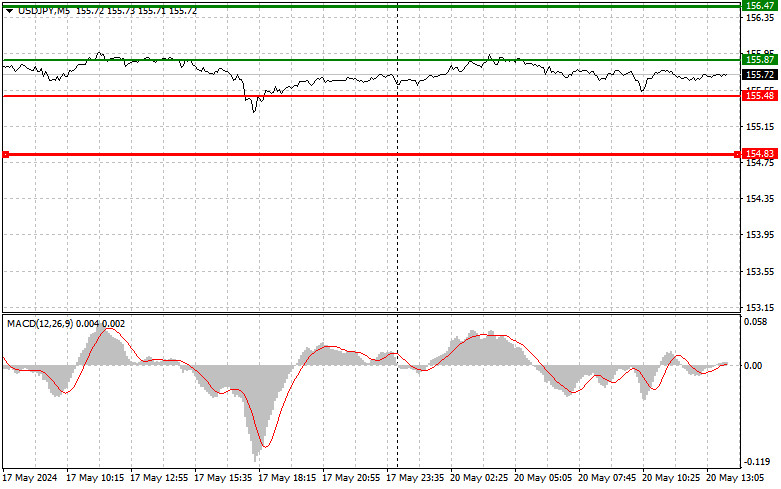
Chart Explanation:
- Thin green line: Entry price for buying the trading instrument.
- Thick green line: Estimated price for setting Take Profit or manually fixing profits, as further growth above this level is unlikely.
- Thin red line: Entry price for selling the trading instrument.
- Thick red line: Estimated price for setting Take Profit or manually fixing profits, as further decline below this level is unlikely.
- MACD Indicator: When entering the market, following overbought and oversold zones is important.
Important: Beginner traders in the forex market should be cautious when making entry decisions. To avoid sharp price fluctuations, staying out of the market before important fundamental reports are released is best. If you decide to trade during news releases, always set stop orders to minimize losses. You can quickly lose your entire deposit without stop orders, especially if you do not use money management and trade in large volumes.
Remember, successful trading requires a clear plan like the one presented above. Spontaneous trading decisions based on the current market situation are initially losing strategies for intraday traders.
The material has been provided by InstaForex Company - www.instaforex.com.GBP/USD: Simple trading tips for novice traders for May 20th (US session)
.Trade analysis and tips for trading the British pound
The first test of the 1.2692 price occurred when the MACD indicator had already dropped significantly below the zero mark, limiting the pair's further downward potential. For this reason, I did not sell and instead waited for the implementation of Scenario 2 for buying. After a short period, another test of 1.2692 occurred when the MACD was already in the oversold area, allowing entry to buy the pound. After that, the pair recovered by almost 20 points. Again, the lack of UK statistics did not favor the pound, although buyers managed to hold daily lows. Besides the speeches from Federal Reserve representatives, nothing interesting is expected during the US session, so it is best to bet on further declines in GBP/USD. Any comments from the Fed about inflation will be interpreted in favor of buying the dollar. As for the intraday strategy, I plan to act based on implementing Scenarios 1 and 2.
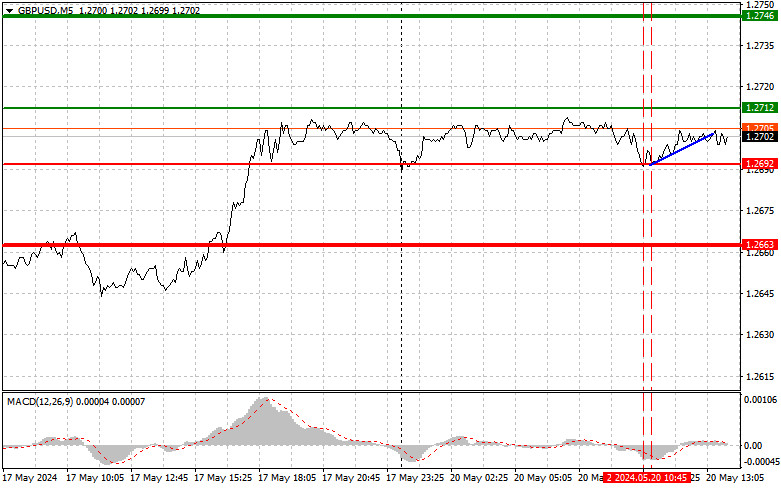
Buy Signal
Scenario 1: Today, I plan to buy the pound upon reaching the entry point around 1.2712 (green line on the chart) with a target of rising to the 1.2746 level (thicker green line on the chart). At around 1.2746, I will exit purchases and open sales in the opposite direction (aiming for a movement of 30–35 points in the opposite direction from the level). Today, you can expect the pound to rise only within a sideways channel. Important! Before buying, ensure the MACD indicator is above the zero mark and starting to rise.
Scenario 2: I also plan to buy the pound today in case of two consecutive tests of the 1.2689 price when the MACD indicator is in the oversold area. This will limit the pair's downward potential and lead to an upward market reversal. You can expect a rise to the opposite levels of 1.2712 and 1.2746.
Sell Signal
Scenario 1: Today, I plan to sell the pound after the level of 1.2689 is updated (red line on the chart), leading to a rapid decline in the pair. The key target for sellers will be the 1.2655 level, where I will exit sales and immediately open purchases in the opposite direction (aiming for a movement of 20–25 points in the opposite direction from the level). Sellers will show themselves in cases of low activity around the daily maximum at the upper boundary of the sideways channel. Important! Before selling, please make sure the MACD indicator is below the zero mark and starting to decline from it.
Scenario 2: I also plan to sell the pound today in case of two consecutive tests of the 1.2712 price when the MACD indicator is in the overbought area. This will limit the pair's upward potential and lead to a market reversal downward. You can expect a decline to the opposite levels of 1.2689 and 1.2655.
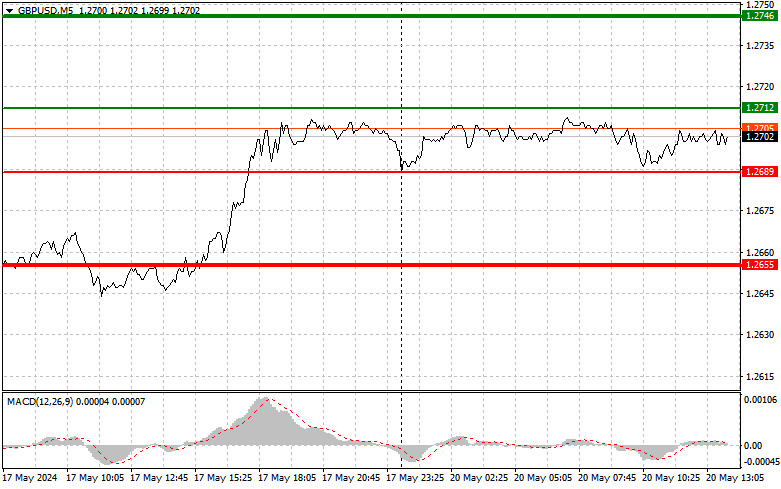
Chart Explanation:
- Thin green line: Entry price for buying the trading instrument.
- Thick green line: Estimated price for setting Take Profit or manually fixing profits, as further growth above this level is unlikely.
- Thin red line: Entry price for selling the trading instrument.
- Thick red line: Estimated price for setting Take Profit or manually fixing profits, as further decline below this level is unlikely.
- MACD Indicator: Following overbought and oversold zones is important when entering the market.
Important: Beginner traders in the forex market should be cautious when making entry decisions. To avoid sharp price fluctuations, it is best to stay out of the market before important fundamental reports are released. If you decide to trade during news releases, always set stop orders to minimize losses. You can quickly lose your entire deposit without stop orders, especially if you do not use money management and trade in large volumes.
Remember, successful trading requires a clear plan like the one presented above. Spontaneous trading decisions based on the current market situation are a losing strategy for intraday traders.
The material has been provided by InstaForex Company - www.instaforex.com.Test your Forex Trading Knowledge | Forex Quiz Free Online 2024

Think you know something about forex? So, to help you measure just how great your Forex skills are, we have designed a little quiz to test your knowledge. Test your knowledge and skills with our forex trading free online quiz!
Our Forex Quiz contains 10 randomly selected multiple choice questions from a pool containing hundreds of Forex trading and stock market-related topics related questions. Our Forex quiz is absolutely free to use, it’s ad-free and you can use it as often as you like.
Daily Forex and Economic News • Read RSS News Online
Encyclopedia: Forex market analysis
What is fundamental, graphical, technical and wave analysis of the Forex market?
Fundamental analysis of the Forex market is a method of forecasting the exchange value of a company's shares, based on the analysis of financial and production indicators of its activities, as well as economic indicators and development factors of countries in order to predict exchange rates.
Graphical analysis of the Forex market is the interpretation of information on the chart in the form of graphic formations and the identification of repeating patterns in them in order to make a profit using graphical models.
Technical analysis of the Forex market is a forecast of the price of an asset based on its past behavior using technical methods: charts, graphical models, indicators, and others.
Wave analysis of the Forex market is a section of technical analysis that reflects the main principle of market behavior: the price does not move in a straight line, but in waves, that is, first there is a price impulse and then the opposite movement (correction).
Share with friends:
* Frequently asked questions:
What are the risks of Forex trading?
Trading Forex and Leveraged Financial Instruments involves significant risk. As a result of various financial fluctuations (change liquidity, price or high volatility), you may not only significantly increase your capital, but also lose it completely. You should not invest more than you can afford to lose and should ensure that you fully understand the risks involved.


